Alabama Water Hardness by County
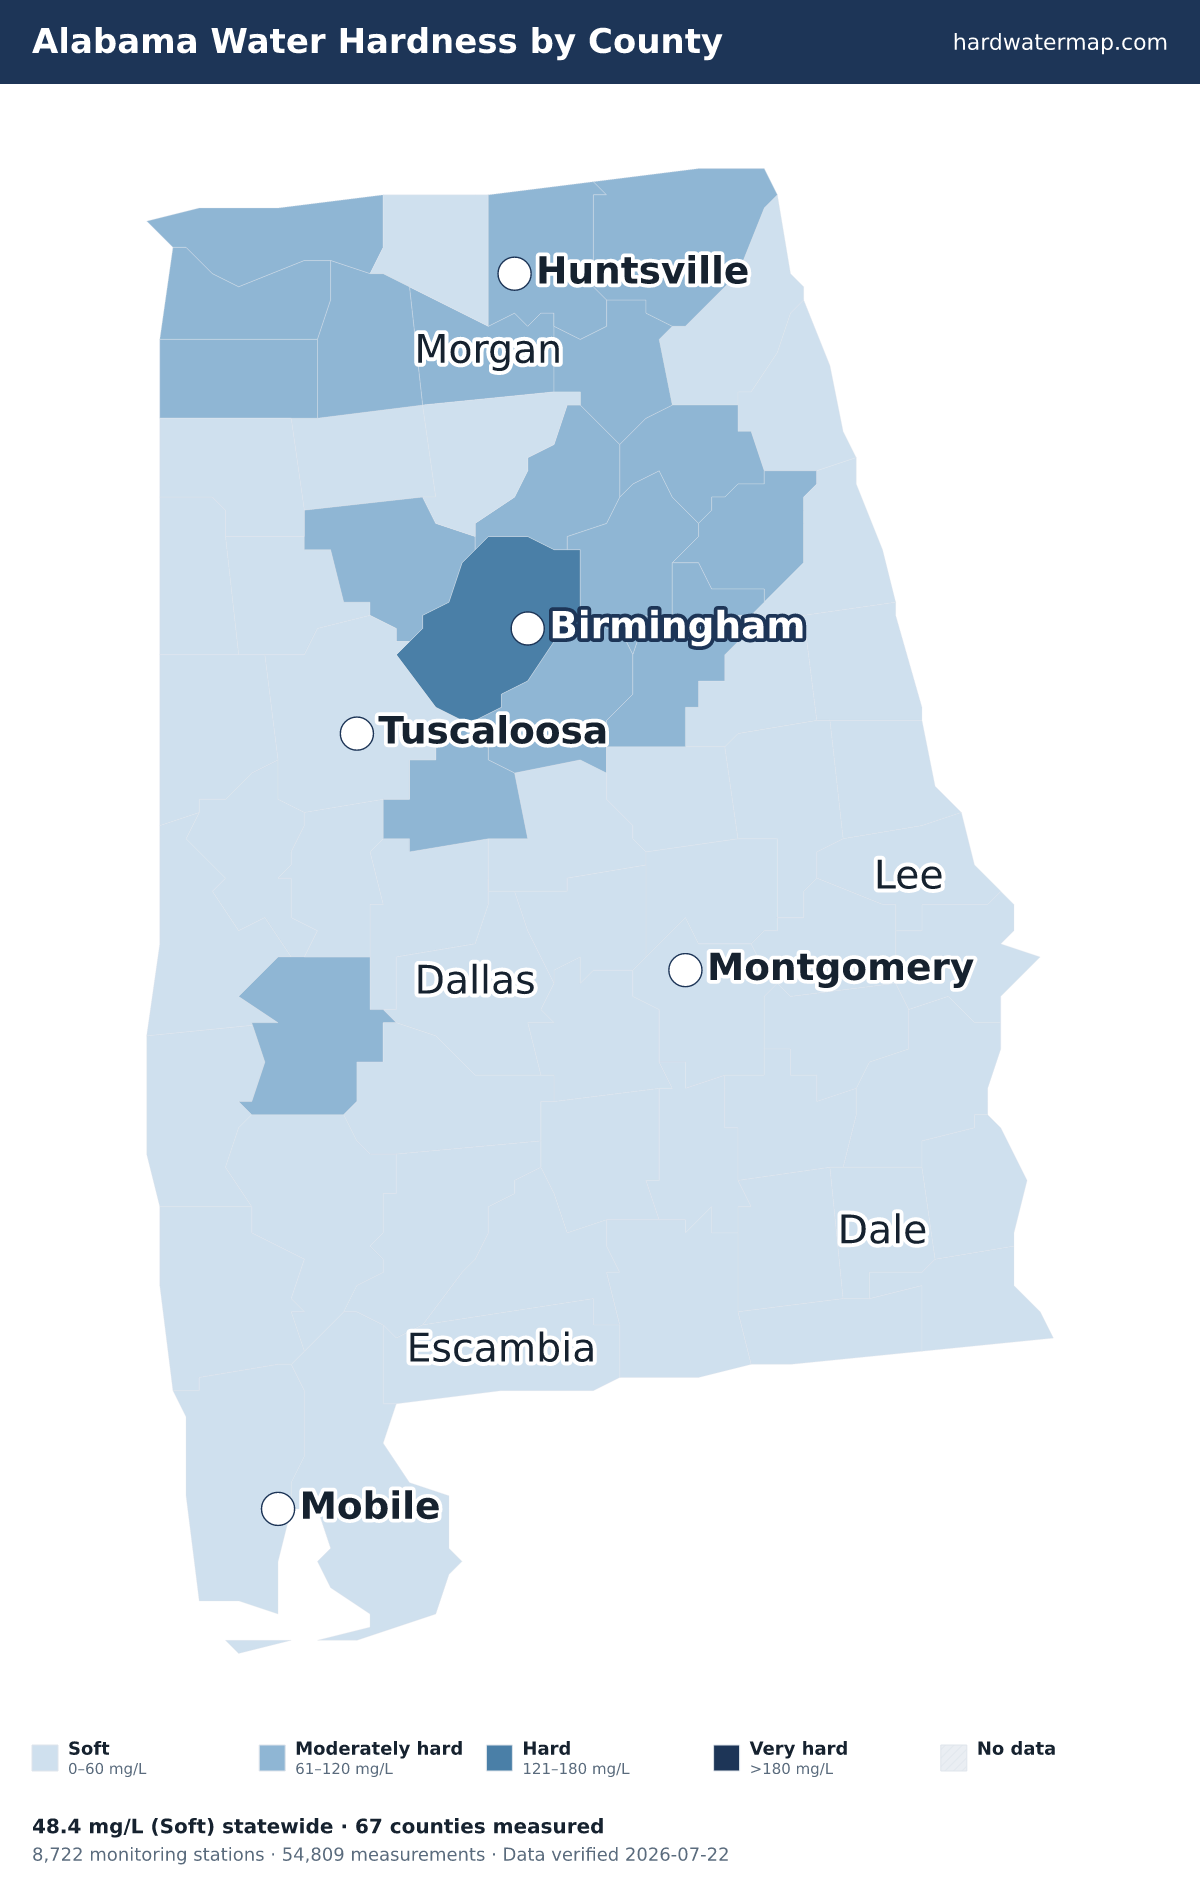
Water in Alabama has a median hardness of 48.4 mg/L as CaCO₃ — "soft" on the USGS scale — based on 54,809 measurements at 8,722 monitoring stations. Jefferson County has the state's hardest measured water (145.5 mg/L); Randolph County the softest (11). Rank: #36 of the 50 states and D.C.
Alabama water hardness map — what the numbers mean. Data verified 2026-07-22.
Of Alabama's 67 measured counties, 1 hard, 17 moderately hard, and 49 soft. The hardest are Jefferson County (145.5 mg/L), Walker County (106), and Jackson County (104). Randolph County is the softest at 11 mg/L (soft).
About 13% of Alabama's roughly 5.1 million residents in counties with gate-passing hardness data live where tap water is hard or worse.
Statewide, Alabama's median works out to 2.8 grains per gallon and ranks #36 of the 50 states and D.C. Across 54,809 measurements at 8,722 stations — 26,750 of them since 2000 — the middle 80% of readings fall between 9 and 171 mg/L. The public record runs from 1927 to 2026.
See where Alabama sits nationally on the national map, or what its number means on the hardness scale.
Download the Alabama water hardness map (PNG) — Water hardness by county in Alabama: 67 counties mapped from USGS/EPA data, statewide median 48.4 mg/L (soft); darker counties have harder water.
By county
Water hardness by county
The table lists all 67 measured Alabama counties, hardest first. Their medians span 145.5 mg/L in Jefferson County to 11 in Randolph County — a 13.2× range.
| County | Median | Band | Results | Sites | Newest |
|---|---|---|---|---|---|
| Jefferson County | 145.5 | Hard | 3,070 | 194 | 2025 |
| Walker County | 106 | Moderately hard | 722 | 90 | 2025 |
| Jackson County | 104 | Moderately hard | 1,033 | 108 | 2025 |
| Lawrence County | 102 | Moderately hard | 610 | 67 | 2024 |
| Shelby County | 91.8 | Moderately hard | 1,540 | 80 | 2025 |
| Franklin County | 91 | Moderately hard | 217 | 53 | 2023 |
| Colbert County | 90 | Moderately hard | 509 | 103 | 2025 |
| Calhoun County | 87.6 | Moderately hard | 329 | 101 | 2025 |
| Morgan County | 85.6 | Moderately hard | 357 | 40 | 2024 |
| Madison County | 83.7 | Moderately hard | 1,940 | 254 | 2024 |
| Talladega County | 80 | Moderately hard | 925 | 64 | 2026 |
| Bibb County | 76.7 | Moderately hard | 630 | 125 | 2024 |
| St. Clair County | 73 | Moderately hard | 759 | 49 | 2025 |
| Blount County | 70 | Moderately hard | 700 | 131 | 2025 |
| Etowah County | 69.8 | Moderately hard | 580 | 48 | 2025 |
| Marengo County | 62 | Moderately hard | 431 | 78 | 2025 |
| Lauderdale County | 61 | Moderately hard | 639 | 108 | 2025 |
| Marshall County | 60.2 | Moderately hard | 467 | 51 | 2025 |
| Limestone County | 58.4 | Soft | 593 | 77 | 2025 |
| Cherokee County | 57.7 | Soft | 1,626 | 63 | 2025 |
| Choctaw County | 56.7 | Soft | 1,658 | 129 | 2025 |
| Lowndes County | 54 | Soft | 305 | 53 | 2023 |
| Butler County | 52.1 | Soft | 198 | 131 | 2022 |
| Clarke County | 50 | Soft | 461 | 126 | 2025 |
| Coffee County | 49.1 | Soft | 200 | 112 | 2024 |
| Greene County | 48.2 | Soft | 696 | 234 | 2025 |
| Wilcox County | 48 | Soft | 639 | 126 | 2023 |
| Hale County | 47.2 | Soft | 758 | 320 | 2024 |
| Mobile County | 46 | Soft | 5,991 | 452 | 2026 |
| Baldwin County | 45 | Soft | 3,129 | 281 | 2025 |
| Dallas County | 45 | Soft | 954 | 281 | 2023 |
| Sumter County | 44 | Soft | 994 | 185 | 2025 |
| Chilton County | 42 | Soft | 449 | 108 | 2025 |
| Washington County | 39.3 | Soft | 335 | 123 | 2025 |
| Houston County | 39 | Soft | 488 | 148 | 2025 |
| Elmore County | 37.5 | Soft | 999 | 161 | 2025 |
| Montgomery County | 37 | Soft | 901 | 234 | 2023 |
| Lee County | 36.7 | Soft | 482 | 53 | 2024 |
| Monroe County | 36 | Soft | 1,184 | 105 | 2023 |
| Crenshaw County | 35 | Soft | 457 | 87 | 2024 |
| Tuscaloosa County | 34 | Soft | 3,224 | 422 | 2025 |
| Macon County | 32.7 | Soft | 301 | 35 | 2023 |
| Bullock County | 32.5 | Soft | 80 | 30 | 2024 |
| Pike County | 32.4 | Soft | 167 | 23 | 2024 |
| Geneva County | 32.1 | Soft | 286 | 105 | 2025 |
| Covington County | 29.3 | Soft | 547 | 130 | 2025 |
| Conecuh County | 28 | Soft | 349 | 126 | 2024 |
| Pickens County | 28 | Soft | 995 | 382 | 2025 |
| Barbour County | 25.2 | Soft | 386 | 147 | 2024 |
| Dale County | 25 | Soft | 522 | 168 | 2024 |
| Chambers County | 24.9 | Soft | 74 | 18 | 2024 |
| Perry County | 24.3 | Soft | 102 | 21 | 2024 |
| DeKalb County | 22.6 | Soft | 494 | 135 | 2025 |
| Russell County | 22.6 | Soft | 391 | 53 | 2026 |
| Marion County | 21 | Soft | 748 | 226 | 2025 |
| Cullman County | 20.2 | Soft | 1,234 | 219 | 2025 |
| Henry County | 20 | Soft | 246 | 117 | 2024 |
| Winston County | 18.9 | Soft | 720 | 109 | 2024 |
| Fayette County | 18.3 | Soft | 347 | 155 | 2025 |
| Clay County | 16.4 | Soft | 238 | 114 | 2025 |
| Coosa County | 15 | Soft | 544 | 123 | 2025 |
| Escambia County | 15 | Soft | 1,328 | 92 | 2025 |
| Cleburne County | 14 | Soft | 469 | 118 | 2025 |
| Tallapoosa County | 12 | Soft | 1,011 | 142 | 2023 |
| Autauga County | 11.6 | Soft | 145 | 26 | 2023 |
| Lamar County | 11.4 | Soft | 261 | 113 | 2025 |
| Randolph County | 11 | Soft | 645 | 40 | 2025 |
ZIP codes
ZIP codes in Alabama
The ZIP codes below are grouped by the Alabama county each mostly falls within (by land area). Each ZIP takes that county's measured median — shown in the group header — so this is a ZIP-to-county guide, not a separate reading for every ZIP. To check the water system serving a specific address, use the lookup.
Key: a † after a ZIP means it has no mapped community water system — usually a private-well area. Plain ZIPs are served by a mapped community water system.
Jefferson County · 145.5 mg/L · Hard
35005†35006†3502035022†35023†3503635060†350613506235064350683507135073†350913509435111†351163511735118†35119351263512735173†3518035181†352033520435205352063520735208352093521035211†3521235213352143521535216352173521835221352223522335224†352263522835229352333523435235†352433524935254
Walker County · 106 mg/L · Moderately hard
35063†35130†351483550135503†35504†35550†3557335578†35579†35580†3558435587†
Jackson County · 104 mg/L · Moderately hard
35740†35744†35745†35746†35751†35752†35764†35765†35766†3576835769†35771†35772†35774†35776†35958†35966†
Lawrence County · 102 mg/L · Moderately hard
35618†35619†35643†35650†35651†35672†35673†
Shelby County · 91.8 mg/L · Moderately hard
35007†350403504335051†35078†35080†3511435115†35124†35143†35147†3517635178†35185†35186†3524235244
Franklin County · 91 mg/L · Moderately hard
35571†3558135582†35585†35593†35653†35654†
Colbert County · 90 mg/L · Moderately hard
35616†35646†3566035661†35674†
Calhoun County · 87.6 mg/L · Moderately hard
3620136203†36205†362063620736250†36265362713627736279†
Morgan County · 85.6 mg/L · Moderately hard
356013560335621†35622†3564035670†35754†35775†
Madison County · 83.7 mg/L · Moderately hard
35741†35748†35749†3575035757†35758†35759†3576035761†35763†35773†3580135802358033580535806†358083581035811358163582435896
Talladega County · 80 mg/L · Moderately hard
35014†350323504435096†35149†3515035151†35160†36260†36268†
Bibb County · 76.7 mg/L · Moderately hard
35034†3503535042†350743518435188†36792†36793†
St. Clair County · 73 mg/L · Moderately hard
35004†35052†35054†351123512035125†35128†35131†35135†35146†35953†35987†
Blount County · 70 mg/L · Moderately hard
3501335031†35049†35079†35097†3512135133†35172†
Etowah County · 69.8 mg/L · Moderately hard
3590135903†3590435905†35906†359073595235954†35956†35972†35990
Marengo County · 62 mg/L · Moderately hard
36732†36736†36738†36742†36748†36754†36763†36764†36782†36783†
Lauderdale County · 61 mg/L · Moderately hard
35610356303563235633†35634†35645†3564835652†35677†
Marshall County · 60.2 mg/L · Moderately hard
350163517535747†35755†3595035951†35957†35976†35980†
Limestone County · 58.4 mg/L · Soft
35611†35613†35614†35615†356203564735649†3567135739†35756†
Cherokee County · 57.7 mg/L · Soft
35959†35960†35973†3598336272
Choctaw County · 56.7 mg/L · Soft
36904†36908†36910†36912†36913†36915†36916†36919†36921†36922†
Lowndes County · 54 mg/L · Soft
36032†36040†36043†36047†36752†36785†
Butler County · 52.1 mg/L · Soft
36030†36033†36037†
Clarke County · 50 mg/L · Soft
36436†3644636451†36482†36524†36540†36545†36727†36751†36784†
Coffee County · 49.1 mg/L · Soft
363233633036346†36351†36453†
Greene County · 48.2 mg/L · Soft
35443†35462†35469†35491†36740†
Wilcox County · 48 mg/L · Soft
36435†36720†36722†36723†36726†36728†36741†36753†36766†36768†36769†
Hale County · 47.2 mg/L · Soft
35441†35474†36744†36776†
Mobile County · 46 mg/L · Soft
36505†3650936512†36521†36522†36523†36525†36528365413654436560†36568†36571†3657236575†3658236587†36602366033660436605366063660736608†3660936610366113661236613366153661736618366193665236663366883669336695
Baldwin County · 45 mg/L · Soft
36507†36511†3652636527†36530†36532†36535†3654236547†3654936550†36551†36555†365593656136562†3656436567†36574†36576†36578†36579†36580†
Dallas County · 45 mg/L · Soft
36701†36703†36759†36761†36767†36773†36775†
Sumter County · 44 mg/L · Soft
35459†35460†35464†35470†35477†36901†36907†36925†
Chilton County · 42 mg/L · Soft
35045†35046†3508535171†36091†36750†36758†36790†
Washington County · 39.3 mg/L · Soft
36513†36518†36529†36538†36539†36548†36553†36556†36558†36569†36581†36583†36584†36585†
Houston County · 39 mg/L · Soft
36301†3630336305†36312†36320†3632136343†3635236370†36376†
Elmore County · 37.5 mg/L · Soft
36020†36022†36024360253605436078†360803609236093
Montgomery County · 37 mg/L · Soft
36013†36036†36052†360573606436069†361013610436105†36106361073610836109361103611136112361133611436115361163611736130
Lee County · 36.7 mg/L · Soft
36801†3680436830†3683236849368653687036874†36877†
Monroe County · 36 mg/L · Soft
36425†3643936444†36445†3646036470†36471†36480†36481†
Crenshaw County · 35 mg/L · Soft
36009†36041†36042†36046†36049†36071†
Tuscaloosa County · 34 mg/L · Soft
35401354043540535406†35444†35446†35452†35453†35456†35457†35458†35463†3547335475†35476†35480†3548735490†35546†
Macon County · 32.7 mg/L · Soft
36031†36039†36075†36083†3608836866†
Bullock County · 32.5 mg/L · Soft
36029†36089
Pike County · 32.4 mg/L · Soft
36005†36010†36034†36035†36079†36081†36082
Geneva County · 32.1 mg/L · Soft
36313†36314†36316†36318†363403634436375†36477†
Covington County · 29.3 mg/L · Soft
36028†3603836420†36421†36442†364553646736474†3647636483†
Conecuh County · 28 mg/L · Soft
36401†36432†36454†36456†36473†36475†
Pickens County · 28 mg/L · Soft
35442†35447†35461†35466†35481†
Barbour County · 25.2 mg/L · Soft
36016†36017†36027†36048†36053†
Dale County · 25 mg/L · Soft
36311†36322†36350†3636036362†36371†36374†
Chambers County · 24.9 mg/L · Soft
36852†3685436855†36862†36863†36879†
Perry County · 24.3 mg/L · Soft
36756†36765†36786†
DeKalb County · 22.6 mg/L · Soft
35961†35962†35963†35967†35968†35971†3597435975†35978†35979†35981†35984†359863598835989†
Russell County · 22.6 mg/L · Soft
36851†3685636858†36860†3686736869†36871†36875†
Marion County · 21 mg/L · Soft
35543†35548†35552†35563†35564†35570
Cullman County · 20.2 mg/L · Soft
35019†35033†3505335055†35057†35058†3507035077†35083†35087†35098†35179†
Henry County · 20 mg/L · Soft
36310†36317†36319†36345†36353†36373†
Winston County · 18.9 mg/L · Soft
35540†35541†35553†35565†35572†35575†35577†
Fayette County · 18.3 mg/L · Soft
35542†3554535549†35554†35555†3555935594†
Clay County · 16.4 mg/L · Soft
35082†36251†36255†36266†36267†
Coosa County · 15 mg/L · Soft
35072†35089†35136†35183†36026†
Escambia County · 15 mg/L · Soft
36426†3644136502†36503†36543†
Cleburne County · 14 mg/L · Soft
36258†36262†36264†36269†36273†
Tallapoosa County · 12 mg/L · Soft
3501036256†36850†36853†36861†
Autauga County · 11.6 mg/L · Soft
36003†36006†36008†36051†3606636067†36749†
Lamar County · 11.4 mg/L · Soft
35544†35574†35576†3558635592†
Randolph County · 11 mg/L · Soft
36263†36274†3627636278†36280†
† 454 ZIP codes are not served by a mapped community water system — most are private-well areas. See well water hardness.
Source
Groundwater vs surface water
Alabama's surface water measures harder than its groundwater — 50.2 mg/L across 45,890 samples versus 36 across 7,817, about 1.4× harder. For well owners that is the better side of a hard bargain: at 36 mg/L, Alabama groundwater is still soft, and most of the state's drinking water is pumped from it. Groundwater readings there run 8 to 180 mg/L across the middle 80% of samples. The comparison draws on 5,237 groundwater and 3,439 surface-water monitoring sites; 982 readings above 2,000 mg/L were logged but held out of the medians as outliers.
Groundwater (wells)
36 mg/L as CaCO₃ · 7,817 results at 5,237 stations.
Surface water (rivers, lakes)
50.2 mg/L as CaCO₃ · 45,890 results at 3,439 stations.
Surface water measures about 1.4× harder than groundwater here.
Chemistry
Water chemistry in Alabama
Beyond the hardness number, Alabama's water carries a fuller chemical signature — here is how its measured parameters compare to national benchmarks.
TDS
90 mg/L · n=32,139
90 mg/L — below the national county median of 226.
pH
7.3 pH · n=172,780
pH 7.3 — within the EPA secondary range of 6.5–8.5, on the alkaline side.
Alkalinity
46.2 mg/L as CaCO3 · n=47,644
46.2 mg/L — modest buffering capacity.
Calcium : Magnesium
16 : 3 mg/L ≈ 5.33 : 1 · n=14,452
Calcium is about 76% of Alabama's hardness (16 mg/L Ca to 3 mg/L Mg), a little more calcium-rich than the national ~68% calcium share.
Parameter medians may include a small share of quality-control samples; the hardness lane is fully QC-filtered.
Aquifers
Major aquifers under Alabama
3 aquifer systems supply much of Alabama's measured groundwater.
- Mississippi embayment aquifer system — median 135 mg/L across 34 samples at 31 sites: hard.
- Valley and Ridge aquifers — median 120 mg/L across 99 samples at 73 sites: hard.
- Floridan aquifer system — median 120 mg/L across 105 samples at 85 sites: hard.
Together these systems account for 238 measured samples at 189 sites. Aquifer medians pool samples across a whole system and can mask local variation — see the national aquifer map for how these compare across states.
Trend
Hardness over time
Alabama's decade median moved from 23.5 mg/L in the 1940s to 49.7 in the 2020s. Over the series, the decade median peaked at 62.8 mg/L in the 1990s and bottomed at 23.5 in the 1940s. Decade medians reflect where and what agencies sampled in each era, not just changes in the water itself.
Scale
Where Alabama sits on the scale
On the USGS scale, Alabama's 48.4 mg/L is soft — 2.8 grains per gallon, below the 60 mg/L soft cutoff — among the softest water measured in the US.
Questions
Frequently asked questions
- Is Alabama's water hard?
- Alabama's median hardness is 48.4 mg/L as CaCO₃, "soft" on the USGS scale and below the national county median of 140 mg/L.
- Which county in Alabama has the hardest water?
- Jefferson County, with a median of 145.5 mg/L as CaCO₃ across 3,070 measurements.
- Is well water harder than city water in Alabama?
- Surface water measures harder here — about 1.4× the groundwater — so wells tend to run softer (groundwater 36 vs surface water 50.2 mg/L).
- How do I find my exact hardness in Alabama?
- Search your ZIP on the lookup tool, read your utility's Consumer Confidence Report, or test at home with a kit.
- Is Alabama's water harder than the national average?
- No. Alabama's median of 48.4 mg/L is below the national county median of 140 mg/L; it ranks #36 of the 50 states and D.C.
Compare
States with similar hardness
Two states measure closest to Alabama's 48.4 mg/L: Oregon at 48.1 mg/L and Vermont at 46.5 mg/L. Alabama measures harder than 30% of states. Browse the full ranking on the statistics page.
More: hardness scale · check your address · national statistics · the national map.
By Marko Visic, MPharm, BSc Physics. Source: USGS/EPA Water Quality Portal — 54,809 Alabama measurements. Data last verified . Methodology.
Cite this page: “Alabama Water Hardness by County.” Hard Water Map. Retrieved 2026-07-22, https://hardwatermap.com/water-hardness/alabama/