US Water Hardness Map

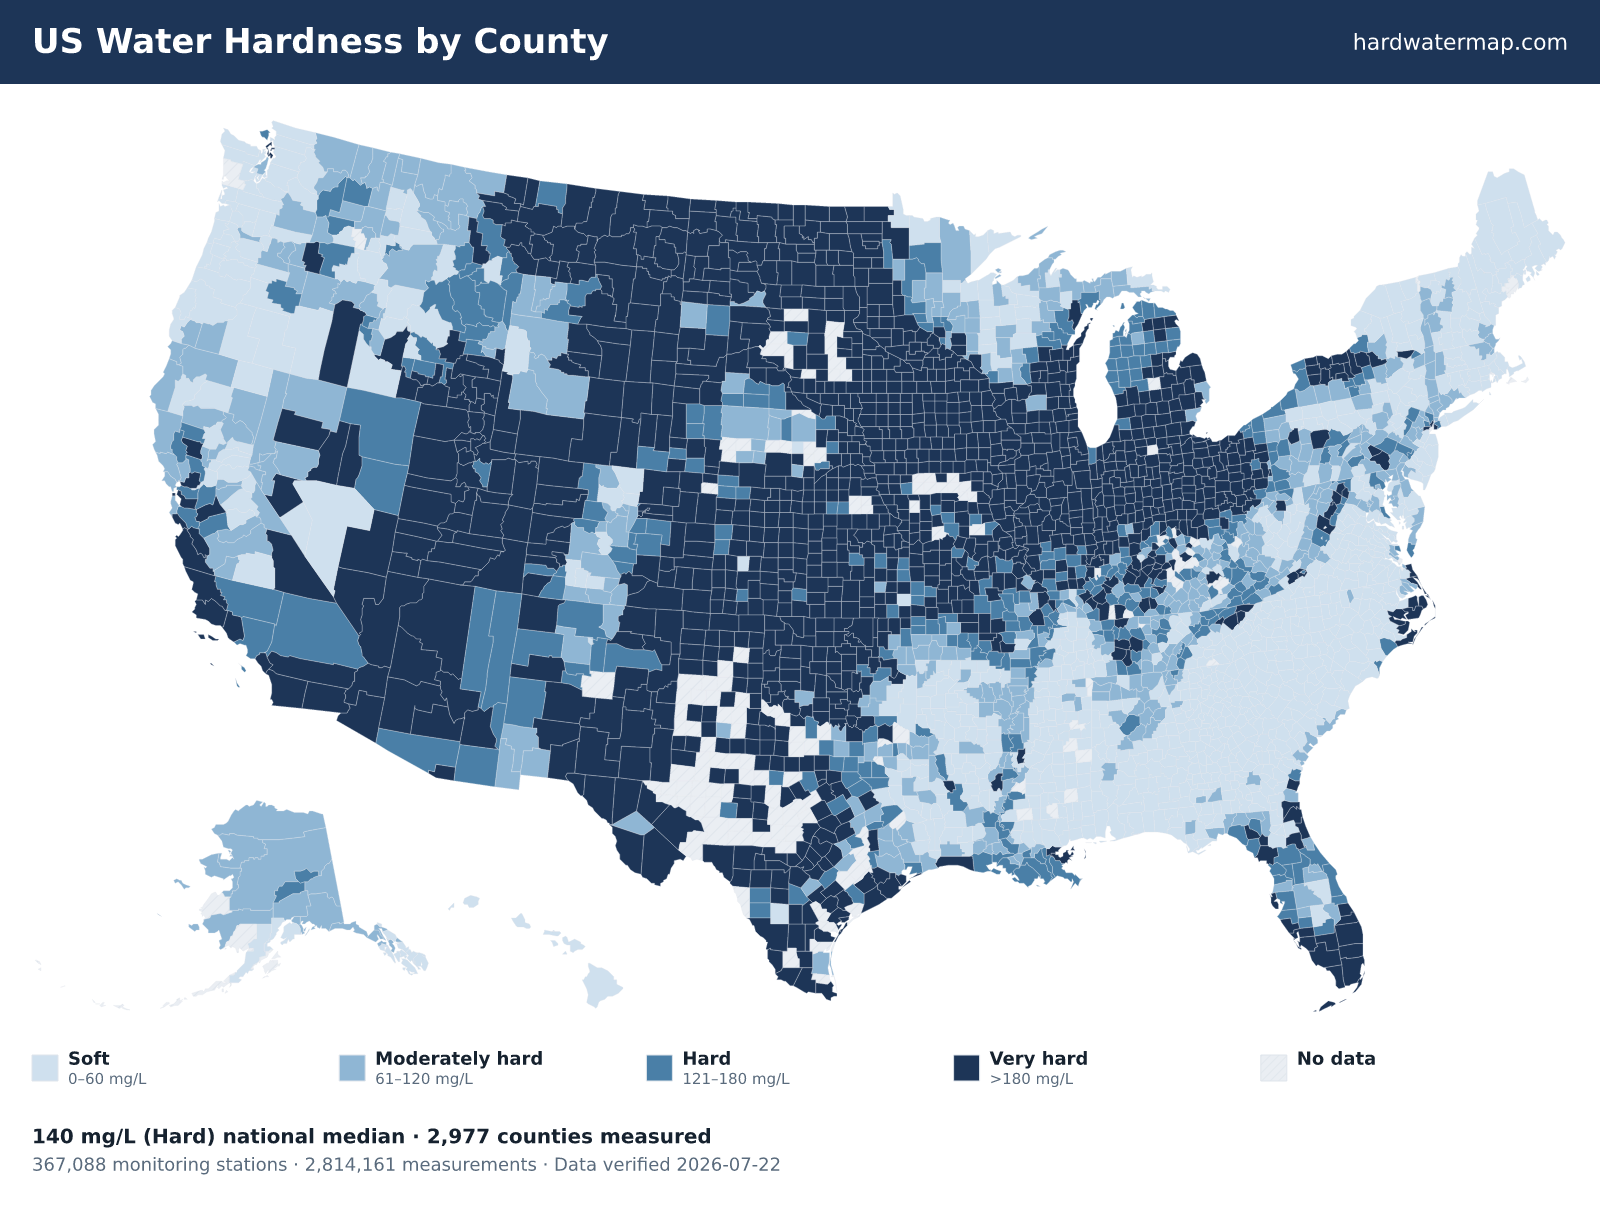
This map shows water hardness for every measured US county, built from 2,814,161 laboratory measurements at ~367,000 USGS and EPA monitoring stations. The national county median is 140 mg/L as CaCO₃ — "hard" on the USGS scale. Counties without sufficient public data are shown in gray, not estimated.

127.9M live in very-hard counties
56.8% in hard-or-worse water
2,977 US counties mapped

The whole country painted from measured data — how this map is built. A hard water map of the United States at county resolution, not city pins.

Gray marks counties with too few public measurements to report — shown as gaps, not estimated. 2,977 counties have enough data to map. Download the US water hardness map (PNG).

2,814,161 measurements~367,000 stationsUSGS/EPA Water Quality Portalverified 2026-07-22updated quarterlyhow it's built →

Explore

Is there hard water in my area?

Three ways to find out. The map above is the picture — pan to your county or search your state. The ZIP lookup finds the utility serving your address, plus your county's measured hardness. And your county's row on its state page gives the measured median from local samples. Hardness varies within a state, so check your own area rather than assume the average.

Address-level results resolve to your water utility on the lookup page.

Data

Hardest and softest states

The gap between hardest and softest is enormous: South Dakota's statewide median of 391 mg/L is 24× Maine's 16 mg/L. Where your state sits on that range decides whether hardness is a daily reality or a non-issue.

Median mg/L as CaCO₃. 127.9M live in very-hard counties; 56.8% in hard-or-worse. Full statistics →

By state

Water hardness by state

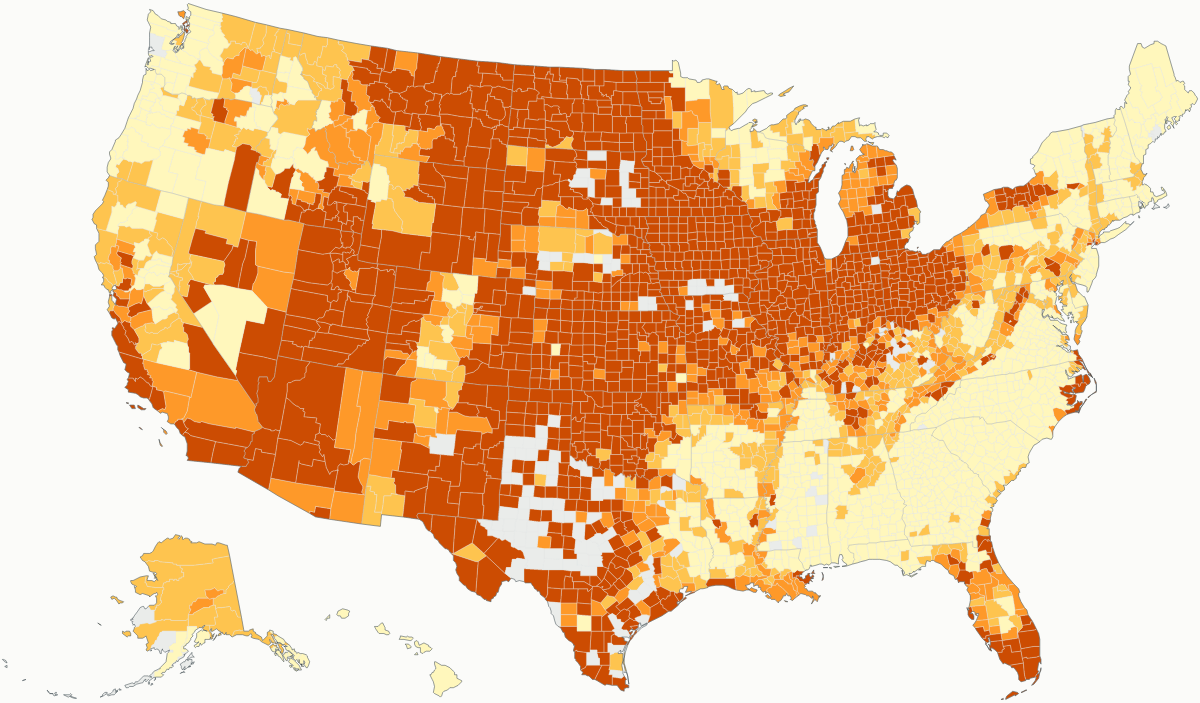
Water hardness in the US follows the geology. The Plains, Upper Midwest, and Southwest run hardest — South Dakota, Iowa, North Dakota, Arizona, and Illinois top the table, all limestone and carbonate-rich groundwater. New England and the Southeast Atlantic run softest, where granite and coastal-plain aquifers leave little calcium behind. See the full ranking on the statistics page, or what each number means on the hardness scale.

AlabamaAlabama has the 16th-softest water of the 50 states and D.C., with a median of 48.4 mg/L — soft. 49 of 67 measured counties are soft; Jefferson is hardest at 145.5 mg/L.AlaskaAlaska has the 21st-softest water of the 50 states and D.C., with a median of 69 mg/L — moderately hard. 9 of 24 measured counties are soft; Fairbanks North Star is hardest at 140 mg/L.ArizonaArizona has the 4th-hardest water of the 50 states and D.C., with a median of 300 mg/L — very hard. All 15 measured counties test hard or harder; Yuma is hardest at 470 mg/L.ArkansasArkansas has the 19th-softest water of the 50 states and D.C., with a median of 62 mg/L — moderately hard. 35 of 75 measured counties are soft; Fulton is hardest at 220 mg/L.CaliforniaCalifornia has the 20th-hardest water of the 50 states and D.C., with a median of 150 mg/L — hard. 26 of 58 measured counties test hard or harder; San Luis Obispo is hardest at 620 mg/L.ColoradoColorado has the 18th-hardest water of the 50 states and D.C., with a median of 157 mg/L — hard. 43 of 63 measured counties test hard or harder; Prowers is hardest at 1300 mg/L.ConnecticutConnecticut has the 12th-softest water of the 50 states and D.C., with a median of 42.9 mg/L — soft. 6 of 8 measured counties are soft; Fairfield is hardest at 86.8 mg/L.DelawareDelaware has the 20th-softest water of the 50 states and D.C., with a median of 63.9 mg/L — moderately hard. 1 of 3 measured counties are soft; New Castle is hardest at 99.8 mg/L.District of ColumbiaDistrict of Columbia has the 25th-hardest water of the 50 states and D.C., with a median of 113 mg/L — moderately hard. It has a single measured county.FloridaFlorida has the 19th-hardest water of the 50 states and D.C., with a median of 151 mg/L — hard. 34 of 67 measured counties test hard or harder; Sarasota is hardest at 381 mg/L.GeorgiaGeorgia has the 6th-softest water of the 50 states and D.C., with a median of 24.4 mg/L — soft. 146 of 159 measured counties are soft; Glynn is hardest at 230 mg/L.HawaiiHawaii has the 10th-softest water of the 50 states and D.C., with a median of 37.8 mg/L — soft. All 5 measured counties are soft; Hawaii is hardest at 57.5 mg/L.IdahoIdaho has the 23rd-hardest water of the 50 states and D.C., with a median of 130 mg/L — hard. 24 of 44 measured counties test hard or harder; Oneida is hardest at 320 mg/L.IllinoisIllinois has the 5th-hardest water of the 50 states and D.C., with a median of 285 mg/L — very hard. 100 of 102 measured counties test hard or harder; Saline is hardest at 449 mg/L.IndianaIndiana has the 6th-hardest water of the 50 states and D.C., with a median of 280 mg/L — very hard. 85 of 89 measured counties test hard or harder; Henry is hardest at 374 mg/L.IowaIowa has the 2nd-hardest water of the 50 states and D.C., with a median of 310 mg/L — very hard. All 91 measured counties test hard or harder; Osceola is hardest at 1300 mg/L.KansasKansas has the 9th-hardest water of the 50 states and D.C., with a median of 260 mg/L — very hard. 102 of 105 measured counties test hard or harder; Hamilton is hardest at 1500 mg/L.KentuckyKentucky has the 24th-hardest water of the 50 states and D.C., with a median of 120 mg/L — hard. 60 of 104 measured counties test hard or harder; McLean is hardest at 437 mg/L.LouisianaLouisiana has the 25th-softest water of the 50 states and D.C., with a median of 90 mg/L — moderately hard. 27 of 64 measured counties are soft; St. Bernard is hardest at 500 mg/L.MaineMaine has the 1st-softest water of the 50 states and D.C., with a median of 16.3 mg/L — soft. All 14 measured counties are soft; York is hardest at 53.5 mg/L.MarylandMaryland has the 17th-softest water of the 50 states and D.C., with a median of 58 mg/L — soft. 12 of 24 measured counties are soft; Washington is hardest at 165 mg/L.MassachusettsMassachusetts has the 13th-softest water of the 50 states and D.C., with a median of 43.7 mg/L — soft. 8 of 12 measured counties are soft; Berkshire is hardest at 119.5 mg/L.MichiganMichigan has the 17th-hardest water of the 50 states and D.C., with a median of 168 mg/L — hard. 66 of 82 measured counties test hard or harder; Huron is hardest at 350 mg/L.MinnesotaMinnesota has the 22nd-hardest water of the 50 states and D.C., with a median of 140 mg/L — hard. 74 of 87 measured counties test hard or harder; Lyon is hardest at 565.5 mg/L.MississippiMississippi has the 4th-softest water of the 50 states and D.C., with a median of 21.1 mg/L — soft. 62 of 74 measured counties are soft; Sharkey is hardest at 224 mg/L.MissouriMissouri has the 15th-hardest water of the 50 states and D.C., with a median of 196 mg/L — very hard. 105 of 110 measured counties test hard or harder; Clay is hardest at 514.5 mg/L.MontanaMontana has the 16th-hardest water of the 50 states and D.C., with a median of 183 mg/L — very hard. 44 of 56 measured counties test hard or harder; Rosebud is hardest at 820 mg/L.NebraskaNebraska has the 12th-hardest water of the 50 states and D.C., with a median of 232 mg/L — very hard. 72 of 81 measured counties test hard or harder; Deuel is hardest at 660 mg/L.NevadaNevada has the 21st-hardest water of the 50 states and D.C., with a median of 150 mg/L — hard. 8 of 17 measured counties test hard or harder; Mineral is hardest at 644 mg/L.New HampshireNew Hampshire has the 5th-softest water of the 50 states and D.C., with a median of 22.9 mg/L — soft. 9 of 10 measured counties are soft; Rockingham is hardest at 62.9 mg/L.New JerseyNew Jersey has the 18th-softest water of the 50 states and D.C., with a median of 59.9 mg/L — soft. 10 of 21 measured counties are soft; Hudson is hardest at 920 mg/L.New MexicoNew Mexico has the 13th-hardest water of the 50 states and D.C., with a median of 207 mg/L — very hard. 26 of 32 measured counties test hard or harder; Eddy is hardest at 1400 mg/L.New YorkNew York has the 8th-softest water of the 50 states and D.C., with a median of 27 mg/L — soft. 24 of 61 measured counties test hard or harder; Monroe is hardest at 350 mg/L.North CarolinaNorth Carolina has the 7th-softest water of the 50 states and D.C., with a median of 27 mg/L — soft. 86 of 99 measured counties are soft; Pamlico is hardest at 470 mg/L.North DakotaNorth Dakota has the 3rd-hardest water of the 50 states and D.C., with a median of 310 mg/L — very hard. 52 of 53 measured counties test hard or harder; Nelson is hardest at 589.5 mg/L.OhioOhio has the 7th-hardest water of the 50 states and D.C., with a median of 270 mg/L — very hard. All 88 measured counties test hard or harder; Belmont is hardest at 374 mg/L.OklahomaOklahoma has the 10th-hardest water of the 50 states and D.C., with a median of 260 mg/L — very hard. 65 of 77 measured counties test hard or harder; Harmon is hardest at 1780 mg/L.OregonOregon has the 15th-softest water of the 50 states and D.C., with a median of 48.1 mg/L — soft. 23 of 36 measured counties are soft; Malheur is hardest at 272 mg/L.PennsylvaniaPennsylvania has the 24th-softest water of the 50 states and D.C., with a median of 83 mg/L — moderately hard. 22 of 67 measured counties are soft; Clarion is hardest at 357.5 mg/L.Rhode IslandRhode Island has the 3rd-softest water of the 50 states and D.C., with a median of 20.2 mg/L — soft. All 4 measured counties are soft; Providence is hardest at 23.9 mg/L.South CarolinaSouth Carolina has the 2nd-softest water of the 50 states and D.C., with a median of 19 mg/L — soft. 44 of 46 measured counties are soft; Beaufort is hardest at 116 mg/L.South DakotaSouth Dakota has the 1st-hardest water of the 50 states and D.C., with a median of 391.4 mg/L — very hard. 54 of 56 measured counties test hard or harder; Brule is hardest at 1300 mg/L.TennesseeTennessee has the 23rd-softest water of the 50 states and D.C., with a median of 82.9 mg/L — moderately hard. 35 of 94 measured counties are soft; Greene is hardest at 246 mg/L.TexasTexas has the 14th-hardest water of the 50 states and D.C., with a median of 200 mg/L — very hard. 136 of 183 measured counties test hard or harder; Childress is hardest at 1600 mg/L.UtahUtah has the 8th-hardest water of the 50 states and D.C., with a median of 270 mg/L — very hard. All 29 measured counties test hard or harder; Emery is hardest at 660 mg/L.VermontVermont has the 14th-softest water of the 50 states and D.C., with a median of 46.5 mg/L — soft. 8 of 13 measured counties are soft; Chittenden is hardest at 109 mg/L.VirginiaVirginia has the 11th-softest water of the 50 states and D.C., with a median of 42 mg/L — soft. 71 of 116 measured counties are soft; Bristol is hardest at 230 mg/L.WashingtonWashington has the 9th-softest water of the 50 states and D.C., with a median of 32.4 mg/L — soft. 20 of 37 measured counties are soft; Island is hardest at 190 mg/L.West VirginiaWest Virginia has the 22nd-softest water of the 50 states and D.C., with a median of 81 mg/L — moderately hard. 18 of 54 measured counties are soft; Brooke is hardest at 323 mg/L.WisconsinWisconsin has the 26th-hardest water of the 50 states and D.C., with a median of 110 mg/L — moderately hard. 42 of 72 measured counties test hard or harder; Iowa is hardest at 390 mg/L.WyomingWyoming has the 11th-hardest water of the 50 states and D.C., with a median of 243.5 mg/L — very hard. 19 of 23 measured counties test hard or harder; Campbell is hardest at 830 mg/L.

Statewide median hardness (mg/L as CaCO₃), each state's silhouette filled by its band. Soft and hard water map, by state.

Tools

Tools & calculators

Every tool here starts from one number — your hardness in mg/L or grains. Get it from the map or the calculator, then size a softener, set its dial, or estimate salt without guessing.

Learn

Learn

Hardness is just dissolved calcium and magnesium, but it drives scale, soap use, and appliance life. These explainers cover what it is, how to read the scale, and how to tell hard from soft — each built on the same measured data as the map.

Wells

Well & groundwater

On a private well? Your water reaches the tap without municipal blending or treatment.

Data

Data & embed

The full dataset is yours: all 2,977 gated counties with median, band, sample count, station count, and newest year, as a single CSV. It's CC BY 4.0 — use it, chart it, cite it; a link back to hardwatermap.com is all we ask.

Questions

Frequently asked questions

Short answers to what people ask most about US water hardness — each links to the page that goes deeper.

Which state has the hardest water?
South Dakota has the hardest tap water of any state, with a statewide median of 391.4 mg/L as CaCO₃. See the full ranking on the statistics page.
What does this map actually measure?
Each county is colored by the median of all measured hardness samples within it — a pooled value from many USGS and EPA monitoring stations, not a single reading. Source: the USGS/EPA Water Quality Portal.
Why is my county gray?
Gray counties do not have enough public measurements to report — fewer than 8 results, fewer than 2 stations, or no reading since 1995. We show that absence rather than estimate a number.
How do I find my exact water hardness?
Three honest routes: search your ZIP to find the utility that serves you, read that utility's annual Consumer Confidence Report, or test at home with a kit or strip.
Is it true that 85% of America has hard water?
The “85%” figure is widely repeated but unsourced. By the USGS definition (hardness above 120 mg/L), a measured 55% of gated US counties are hard or harder, and about 56.8% of the US population lives in hard-or-worse counties — counties and people are two different measures. See the breakdown.
How hard is the water in my area?
Three ways: pan the map to your county, search your ZIP to find your utility, or open your state page for the measured county median. Hardness varies locally, so check your own area rather than the state average.
By . Source: USGS/EPA Water Quality Portal (2,814,161 measurements, 51 states). Data last verified . Methodology.

Cite this page:US Water Hardness Map.” Hard Water Map. Retrieved 2026-07-22, https://hardwatermap.com/