Hardest water in the US: all 51 states ranked
Search “hardest water in the US” and you get a dozen lists that don't agree and never say how they were built. This one does: the only ranking computed from the measured data itself — every US state ordered by the median of its own samples, with the sample count under each figure so you can see how much stands behind it.
South Dakota has the hardest measured water of any state (median 391.4 mg/L as CaCO₃) and Maine the softest (16.3 mg/L), across 2,814,161 samples at ~367,000 monitoring stations. The national county median is 140 mg/L — "hard." About 127.9 million Americans live in very-hard-water counties; 56.8% live where water is hard or worse.
Rankings
Water hardness by state, ranked
Ranked by the median of each state's measured samples (mg/L as CaCO₃) — the same figure each state page displays. Samples is the number of lab measurements; Sites is the number of monitoring stations.
| Rank | State | Median | Band | Samples | Sites | |
|---|---|---|---|---|---|---|
| 1 | South Dakota | 391.4 | Very hard | 54,706 | 23,553 | view → |
| 2 | Iowa | 310 | Very hard | 22,531 | 5,050 | view → |
| 3 | North Dakota | 310 | Very hard | 50,468 | 10,106 | view → |
| 4 | Arizona | 300 | Very hard | 59,446 | 13,756 | view → |
| 5 | Illinois | 285 | Very hard | 77,308 | 4,491 | view → |
| 6 | Indiana | 280 | Very hard | 31,097 | 5,980 | view → |
| 7 | Ohio | 270 | Very hard | 93,580 | 10,558 | view → |
| 8 | Utah | 270 | Very hard | 138,737 | 13,140 | view → |
| 9 | Kansas | 260 | Very hard | 103,475 | 11,195 | view → |
| 10 | Oklahoma | 260 | Very hard | 97,469 | 6,695 | view → |
| 11 | Wyoming | 243.5 | Very hard | 44,904 | 5,538 | view → |
| 12 | Nebraska | 232 | Very hard | 23,863 | 3,693 | view → |
| 13 | New Mexico | 207 | Very hard | 43,494 | 9,362 | view → |
| 14 | Texas | 200 | Very hard | 116,518 | 8,600 | view → |
| 15 | Missouri | 196 | Very hard | 34,925 | 5,442 | view → |
| 16 | Montana | 183 | Very hard | 84,286 | 14,986 | view → |
| 17 | Michigan | 168 | Hard | 21,097 | 4,874 | view → |
| 18 | Colorado | 157 | Hard | 218,893 | 18,406 | view → |
| 19 | Florida | 151 | Hard | 150,764 | 15,636 | view → |
| 20 | California | 150 | Hard | 105,884 | 20,318 | view → |
| 21 | Nevada | 150 | Hard | 22,166 | 3,755 | view → |
| 22 | Minnesota | 140 | Hard | 62,159 | 7,816 | view → |
| 23 | Idaho | 130 | Hard | 33,016 | 6,790 | view → |
| 24 | Kentucky | 120 | Hard | 28,806 | 4,428 | view → |
| 25 | District of Columbia | 113 | Moderately hard | 119 | 61 | view → |
| 26 | Wisconsin | 110 | Moderately hard | 33,134 | 6,437 | view → |
| 27 | Louisiana | 90 | Moderately hard | 81,193 | 12,387 | view → |
| 28 | Pennsylvania | 83 | Moderately hard | 118,614 | 11,936 | view → |
| 29 | Tennessee | 82.9 | Moderately hard | 47,207 | 6,452 | view → |
| 30 | West Virginia | 81 | Moderately hard | 13,527 | 4,551 | view → |
| 31 | Alaska | 69 | Moderately hard | 16,032 | 3,534 | view → |
| 32 | Delaware | 63.9 | Moderately hard | 38,083 | 1,599 | view → |
| 33 | Arkansas | 62 | Moderately hard | 96,699 | 6,139 | view → |
| 34 | New Jersey | 59.9 | Soft | 44,400 | 5,429 | view → |
| 35 | Maryland | 58 | Soft | 14,908 | 4,673 | view → |
| 36 | Alabama | 48.4 | Soft | 54,809 | 8,722 | view → |
| 37 | Oregon | 48.1 | Soft | 50,168 | 7,348 | view → |
| 38 | Vermont | 46.5 | Soft | 10,998 | 2,531 | view → |
| 39 | Massachusetts | 43.7 | Soft | 10,226 | 2,358 | view → |
| 40 | Connecticut | 42.9 | Soft | 19,533 | 2,571 | view → |
| 41 | Virginia | 42 | Soft | 53,216 | 5,085 | view → |
| 42 | Hawaii | 37.8 | Soft | 3,112 | 455 | view → |
| 43 | Washington | 32.4 | Soft | 78,339 | 7,030 | view → |
| 44 | New York | 27 | Soft | 82,230 | 10,470 | view → |
| 45 | North Carolina | 27 | Soft | 79,363 | 6,311 | view → |
| 46 | Georgia | 24.4 | Soft | 92,696 | 5,238 | view → |
| 47 | New Hampshire | 22.9 | Soft | 4,951 | 2,284 | view → |
| 48 | Mississippi | 21.1 | Soft | 11,284 | 4,240 | view → |
| 49 | Rhode Island | 20.2 | Soft | 3,496 | 538 | view → |
| 50 | South Carolina | 19 | Soft | 32,742 | 3,601 | view → |
| 51 | Maine | 16.3 | Soft | 3,490 | 940 | view → |
Interpretation
The regional story the ranking tells
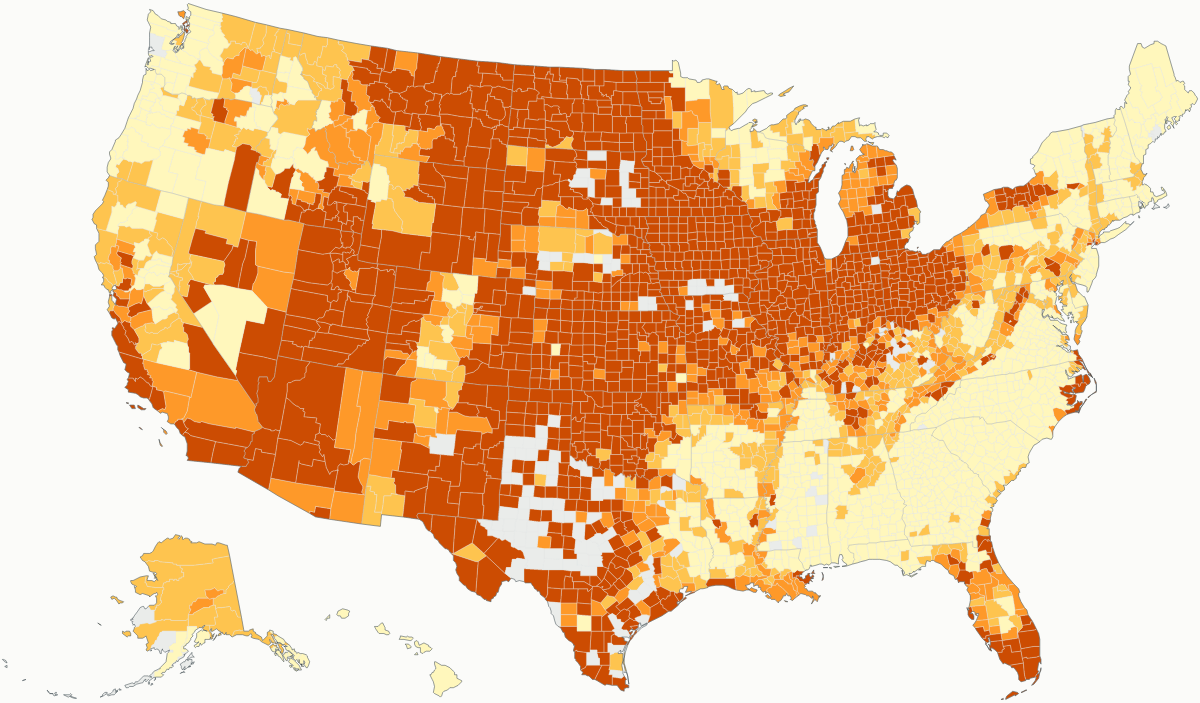
The order isn't random — it's geology. All ten hardest states sit in the carbonate-rock interior: the Plains, the Upper Midwest, and the Southwest, where groundwater moves through limestone and dolomite and dissolves calcium and magnesium along the way. South Dakota tops the list at 391.4 mg/L.
The softest states cluster where the bedrock doesn't give up minerals — New England's granite and the sandy coastal Southeast — with Maine lowest at 16.3 mg/L. That's the same pattern the aquifer map draws out; for the rock story behind the numbers, see the US aquifer hardness map. This is why a state ranking is really an aquifer ranking in disguise.
Methods
Why published rankings disagree
Search “hardest water in the US” and no two lists match — and none says how it was built. That's not dishonesty so much as different questions wearing the same headline.
A ranking can measure very different things. Some average a handful of city utility reports; utility numbers are real but sparse, and a few cities can't stand in for a state. Some synthesize figures from mixed sources into a single “average” without saying which samples, which years, or how they were weighted. Some weight by population, which answers “where do the most people meet hard water,” not “where is the water hardest.” Each is a legitimate question, but they produce different lists.
This page answers one plainly stated question: across all measured samples, what is the median hardness of each state? Every row shows the median, the number of results behind it, and the number of monitoring stations, so you can see how much data stands under each figure. The full method is in the methodology.
A worked example — our own numbers
Rank the states by pooled measurements, the way this page and every state page do, and South Dakota's median is 391.4 mg/L. Rank instead by the median of South Dakota's counties — each county counting once, however many samples it holds — and the figure is 426.6 mg/L. Both are correct; they answer different questions. The first asks “what does a typical measured sample show?”; the second asks “what does a typical county show?” Sampling density differs by county, so the two diverge. We rank by pooled measurements for one reason: it is the metric every state page already displays, so the numbers never disagree with themselves. Both columns ship in the state-rankings CSV — check our work.
Myth check
Is it true that 85% of America has hard water?
You'll see “85%” everywhere, almost always without a source — and it is sometimes even misattributed to the USGS, which publishes no such figure. It appears to have spread by repetition: one page cites another citing another, until the number feels official. It may not be wrong so much as unaccountable — nobody can point to how it was measured.
Here is what our measured data shows, at the USGS definition of “hard” (over 120 mg/L as CaCO₃): 55% of the 2,977 gated counties are hard or harder, and 56.8% of the mapped population lives where water is hard or worse. The two answer different questions — one counts places, the other counts people — and neither is 85%.
The gap is mostly definitional: stretch “hard” downward and the share rises. Some vendor charts even add an invented fifth band (“extremely hard”) above the standard four, which reshuffles where the lines fall. Draw them at the federal USGS cut and measure, and the honest answer is 55–57%, not 85%.
National
The national numbers
- 127.9M live in very-hard counties (39%).
- 58.4M in hard counties (17.8%).
- 58.9M in moderately-hard counties (18%).
- 82.5M in soft-water counties (25.2%).
- Hard or worse: 186.4M — 56.8% of mapped population, and 1,641 of 2,977 gated counties (55%).
- The national county median is 140 mg/L — a distinct figure from the state ranking above.
Trend
Measured hardness by decade
National series pooled from all 51 states, sample-count-weighted per decade. Early decades rest on thin data — read the shape, not the point values.
Counties
Hardest and softest measured counties
| # | County | State | Median | Samples | sites |
|---|---|---|---|---|---|
| 1 | Harmon County | OK | 1780 | 778 | 43 |
| 2 | Dewey County | OK | 1700 | 227 | 35 |
| 3 | Reeves County | TX | 1600 | 446 | 10 |
| 4 | King County | TX | 1600 | 1,358 | 43 |
| 5 | Childress County | TX | 1600 | 524 | 9 |
| 6 | Collingsworth County | TX | 1500 | 382 | 2 |
| 7 | Hamilton County | KS | 1500 | 874 | 95 |
| 8 | Jackson County | OK | 1470 | 422 | 115 |
| 9 | Eddy County | NM | 1400 | 5,086 | 496 |
| 10 | Brule County | SD | 1300 | 65 | 42 |
| 11 | Chaves County | NM | 1300 | 1,290 | 370 |
| 12 | Osceola County | IA | 1300 | 75 | 30 |
| 13 | Prowers County | CO | 1300 | 881 | 179 |
| 14 | Greer County | OK | 1200 | 866 | 58 |
| 15 | Wichita County | TX | 1160 | 813 | 8 |
| 16 | Stonewall County | TX | 1100 | 2,712 | 24 |
| 17 | Foard County | TX | 1100 | 257 | 6 |
| 18 | Cottle County | TX | 1100 | 841 | 7 |
| 19 | Washita County | OK | 1090 | 322 | 51 |
| 20 | Tillman County | OK | 1009 | 1,237 | 24 |
| 21 | Bent County | CO | 980 | 2,020 | 145 |
| 22 | Kent County | TX | 970 | 359 | 22 |
| 23 | De Baca County | NM | 960 | 293 | 82 |
| 24 | Knox County | TX | 950 | 1,107 | 53 |
| 25 | Woods County | OK | 950 | 1,060 | 78 |
| # | County | State | Median | Samples | sites |
|---|---|---|---|---|---|
| 1 | Wilkinson County | MS | 0.8 | 169 | 30 |
| 2 | Hancock County | MS | 1 | 357 | 55 |
| 3 | Scott County | KS | 1.2 | 1,197 | 78 |
| 4 | Floyd County | IN | 1.8 | 12 | 5 |
| 5 | Crawford County | KS | 1.8 | 1,771 | 113 |
| 6 | Perry County | MS | 2.8 | 565 | 86 |
| 7 | Tuolumne County | CA | 3.1 | 394 | 83 |
| 8 | Towns County | GA | 3.6 | 433 | 20 |
| 9 | Aiken County | SC | 4.5 | 841 | 168 |
| 10 | Bennington County | VT | 4.5 | 910 | 204 |
| 11 | Oconee County | SC | 4.6 | 1,334 | 101 |
| 12 | Harrison County | MS | 5 | 541 | 210 |
| 13 | Hamilton County | NY | 5 | 2,755 | 245 |
| 14 | Transylvania County | NC | 5 | 865 | 23 |
| 15 | Lee County | SC | 5 | 282 | 20 |
| 16 | Rabun County | GA | 5.1 | 806 | 40 |
| 17 | Windham County | VT | 5.2 | 969 | 219 |
| 18 | Fannin County | GA | 5.4 | 680 | 51 |
| 19 | Marion County | GA | 5.4 | 56 | 11 |
| 20 | Lumpkin County | GA | 5.5 | 957 | 28 |
| 21 | Taylor County | GA | 5.5 | 290 | 28 |
| 22 | Petersburg County | AK | 6 | 50 | 14 |
| 23 | Peach County | GA | 6 | 21 | 10 |
| 24 | St. Helena County | LA | 6 | 92 | 44 |
| 25 | Oxford County | ME | 6 | 897 | 184 |
Data
Data & downloads
Per-state files ship with the city release.
Cities
Hardest cities
City-level rankings arrive with the Phase-1 city release; until then, use the ZIP lookup for your local utility.
Questions
Frequently asked
- Which state has the hardest water?
- South Dakota, with a median of 391.4 mg/L as CaCO₃ across its measured samples — its groundwater-heavy sampling runs high, which pushes the median up.
- Which state has the softest water?
- Maine, at 16.3 mg/L as CaCO₃ — the lowest measured state median in the country.
- Is it true that 85% of America has hard water?
- The 85% figure is unsourced and sometimes misattributed to the USGS. Measured at the USGS definition of hard (over 120 mg/L), 55% of gated counties and 56.8% of the mapped population are hard or worse — not 85%.
- What is the average water hardness in the US?
- The national county median is 140 mg/L as CaCO₃, which is “hard.” We report the median, not the mean, because hardness is heavily skewed and a mean would be pulled up by extremes.
- How many Americans live with hard water?
- About 186.4 million live in hard-or-worse counties and 127.9 million in very-hard counties, from the dated statistics release.
By Marko Visic, MPharm, BSc Physics. Source: USGS/EPA Water Quality Portal — 2,814,161 samples; state rankings by median of measurements. Data last verified . Methodology.
Cite this page: “Hardest Water in the US: All 51 States Ranked.” Hard Water Map. Retrieved 2026-07-27, https://hardwatermap.com/water-hardness-statistics/