Kentucky Water Hardness by County
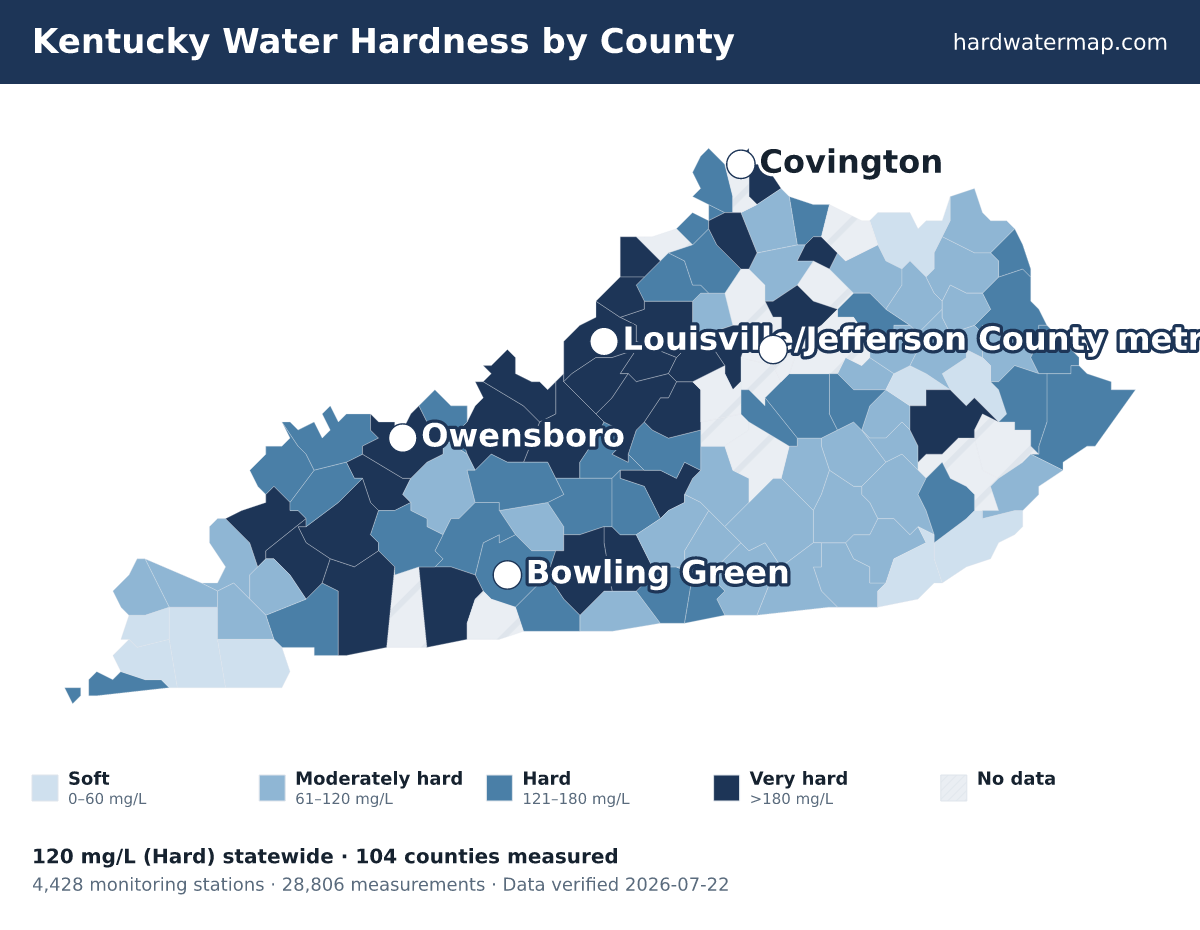
Water in Kentucky has a median hardness of 120 mg/L as CaCO₃ — "hard" on the USGS scale — based on 28,806 measurements at 4,428 monitoring stations. McLean County has the state's hardest measured water (437 mg/L); Graves County the softest (23.5). Rank: #24 of the 50 states and D.C.
Kentucky water hardness map — what the numbers mean. Data verified 2026-07-22.
Of Kentucky's 104 measured counties, 28 very hard, 32 hard, 35 moderately hard, and 9 soft. The hardest are McLean County (437 mg/L), Jefferson County (395), and Taylor County (315). Graves County is the softest at 23.5 mg/L (soft).
About 74% of Kentucky's roughly 3.7 million residents in counties with gate-passing hardness data live where tap water is hard or worse.
Statewide, Kentucky's median works out to 7 grains per gallon and ranks #24 of the 50 states and D.C. Across 28,806 measurements at 4,428 stations — 10,626 of them since 2000 — the middle 80% of readings fall between 41 and 280 mg/L. The public record runs from 1906 to 2026.
See where Kentucky sits nationally on the national map, or what its number means on the hardness scale.
Download the Kentucky water hardness map (PNG) — Water hardness by county in Kentucky: 104 counties mapped from USGS/EPA data, statewide median 120 mg/L (hard); darker counties have harder water.
By county
Water hardness by county
The table lists all 104 measured Kentucky counties, hardest first. Their medians span 437 mg/L in McLean County to 23.5 in Graves County — a 18.6× range. 16 more Kentucky counties lack gate-passing data.
| County | Median | Band | Results | Sites | Newest |
|---|---|---|---|---|---|
| McLean County | 437 | Very hard | 42 | 14 | 2007 |
| Jefferson County | 395 | Very hard | 1,148 | 194 | 2024 |
| Taylor County | 315 | Very hard | 47 | 24 | 2006 |
| Trimble County | 300 | Very hard | 33 | 18 | 2005 |
| Metcalfe County | 295 | Very hard | 85 | 65 | 2007 |
| Meade County | 290 | Very hard | 213 | 116 | 2019 |
| Campbell County | 280 | Very hard | 51 | 28 | 2005 |
| Hopkins County | 254.5 | Very hard | 380 | 66 | 2007 |
| Breathitt County | 253 | Very hard | 281 | 38 | 2007 |
| Breckinridge County | 246 | Very hard | 117 | 75 | 2007 |
| Oldham County | 240 | Very hard | 78 | 20 | 2019 |
| Anderson County | 226 | Very hard | 93 | 13 | 2007 |
| Shelby County | 220 | Very hard | 86 | 19 | 2000 |
| Grant County | 215.5 | Very hard | 38 | 12 | 2004 |
| Robertson County | 211 | Very hard | 15 | 4 | 2005 |
| Woodford County | 210 | Very hard | 70 | 19 | 1999 |
| Bourbon County | 207.5 | Very hard | 162 | 15 | 2007 |
| Crittenden County | 205.5 | Very hard | 63 | 28 | 2006 |
| Spencer County | 203 | Very hard | 85 | 10 | 2007 |
| Christian County | 200 | Very hard | 105 | 46 | 2007 |
| Hardin County | 199 | Very hard | 496 | 181 | 2007 |
| Bullitt County | 197 | Very hard | 493 | 20 | 2007 |
| Washington County | 196.5 | Very hard | 88 | 6 | 2007 |
| Nelson County | 195 | Very hard | 109 | 20 | 2005 |
| Caldwell County | 190 | Very hard | 678 | 30 | 2023 |
| Logan County | 184 | Very hard | 174 | 54 | 2007 |
| Barren County | 181 | Very hard | 91 | 35 | 2007 |
| Daviess County | 180 | Very hard | 210 | 81 | 2019 |
| Floyd County | 179.5 | Hard | 260 | 26 | 2007 |
| Pike County | 177 | Hard | 862 | 108 | 2026 |
| Madison County | 164 | Hard | 149 | 20 | 2007 |
| Owen County | 163 | Hard | 88 | 16 | 2007 |
| Fulton County | 160 | Hard | 81 | 70 | 2014 |
| Larue County | 160 | Hard | 126 | 48 | 2006 |
| Martin County | 160 | Hard | 97 | 46 | 2007 |
| Warren County | 159 | Hard | 311 | 53 | 2007 |
| Marion County | 157.5 | Hard | 14 | 3 | 2000 |
| Grayson County | 155 | Hard | 38 | 21 | 2007 |
| Garrard County | 151 | Hard | 141 | 16 | 2007 |
| Union County | 150.1 | Hard | 265 | 39 | 2024 |
| Bath County | 149 | Hard | 97 | 13 | 2007 |
| Trigg County | 149 | Hard | 582 | 45 | 2023 |
| Estill County | 148.5 | Hard | 150 | 32 | 2007 |
| Leslie County | 145 | Hard | 89 | 20 | 2007 |
| Green County | 144 | Hard | 418 | 48 | 2007 |
| Gallatin County | 141 | Hard | 759 | 19 | 2024 |
| Clinton County | 140 | Hard | 141 | 12 | 2014 |
| Henderson County | 140 | Hard | 315 | 94 | 2007 |
| Muhlenberg County | 140 | Hard | 115 | 35 | 2007 |
| Webster County | 140 | Hard | 250 | 29 | 2007 |
| Boone County | 139.6 | Hard | 59 | 22 | 2016 |
| Butler County | 136 | Hard | 361 | 15 | 2007 |
| Bracken County | 134 | Hard | 197 | 9 | 2024 |
| Cumberland County | 132 | Hard | 76 | 12 | 2005 |
| Hart County | 130 | Hard | 897 | 85 | 2007 |
| Henry County | 130 | Hard | 247 | 17 | 2004 |
| Hancock County | 128.5 | Hard | 188 | 41 | 2024 |
| Lawrence County | 128 | Hard | 391 | 40 | 2007 |
| Allen County | 120 | Hard | 202 | 79 | 2007 |
| Boyd County | 120 | Hard | 265 | 24 | 2007 |
| Franklin County | 110 | Moderately hard | 785 | 25 | 2007 |
| Pendleton County | 110 | Moderately hard | 781 | 11 | 2007 |
| Greenup County | 109 | Moderately hard | 530 | 28 | 2024 |
| Harrison County | 108.5 | Moderately hard | 105 | 13 | 2007 |
| Ballard County | 104 | Moderately hard | 143 | 50 | 2024 |
| Knox County | 103 | Moderately hard | 36 | 16 | 2005 |
| Ohio County | 103 | Moderately hard | 306 | 43 | 2007 |
| Elliott County | 100 | Moderately hard | 52 | 12 | 2007 |
| Johnson County | 100 | Moderately hard | 182 | 35 | 2007 |
| Lee County | 100 | Moderately hard | 191 | 15 | 2007 |
| Clay County | 98 | Moderately hard | 164 | 34 | 2007 |
| Livingston County | 98 | Moderately hard | 525 | 21 | 2024 |
| Wayne County | 98 | Moderately hard | 317 | 19 | 2014 |
| Carter County | 97 | Moderately hard | 147 | 20 | 2007 |
| Rockcastle County | 95.8 | Moderately hard | 102 | 12 | 2007 |
| Casey County | 95.5 | Moderately hard | 8 | 4 | 2006 |
| Lyon County | 95.5 | Moderately hard | 241 | 19 | 2023 |
| Letcher County | 94 | Moderately hard | 162 | 142 | 2007 |
| Pulaski County | 92 | Moderately hard | 550 | 20 | 2014 |
| Edmonson County | 90.8 | Moderately hard | 822 | 58 | 2007 |
| Powell County | 90 | Moderately hard | 105 | 13 | 2007 |
| Fleming County | 89 | Moderately hard | 94 | 43 | 2005 |
| Morgan County | 87.6 | Moderately hard | 122 | 16 | 2007 |
| Owsley County | 81.9 | Moderately hard | 134 | 10 | 2007 |
| Monroe County | 81.3 | Moderately hard | 74 | 4 | 2007 |
| Adair County | 80.8 | Moderately hard | 131 | 18 | 2007 |
| Jackson County | 79.8 | Moderately hard | 119 | 15 | 2007 |
| Russell County | 76.7 | Moderately hard | 200 | 12 | 2014 |
| Rowan County | 75.2 | Moderately hard | 38 | 12 | 2005 |
| Whitley County | 73.3 | Moderately hard | 812 | 22 | 2022 |
| Laurel County | 71.8 | Moderately hard | 429 | 33 | 2022 |
| McCracken County | 65.5 | Moderately hard | 540 | 40 | 2023 |
| McCreary County | 64 | Moderately hard | 935 | 52 | 2014 |
| Marshall County | 62 | Moderately hard | 337 | 151 | 2013 |
| Menifee County | 62 | Moderately hard | 66 | 9 | 2007 |
| Harlan County | 59 | Soft | 690 | 51 | 2022 |
| Magoffin County | 55 | Soft | 115 | 19 | 2000 |
| Bell County | 49 | Soft | 1,981 | 134 | 2007 |
| Lewis County | 46.1 | Soft | 104 | 35 | 2019 |
| Wolfe County | 44 | Soft | 99 | 16 | 2007 |
| Hickman County | 34 | Soft | 165 | 63 | 2007 |
| Carlisle County | 33.8 | Soft | 160 | 47 | 2007 |
| Calloway County | 31 | Soft | 225 | 160 | 2009 |
| Graves County | 23.5 | Soft | 312 | 171 | 2018 |
ZIP codes
ZIP codes in Kentucky
The ZIP codes below are grouped by the Kentucky county each mostly falls within (by land area). Each ZIP takes that county's measured median — shown in the group header — so this is a ZIP-to-county guide, not a separate reading for every ZIP. To check the water system serving a specific address, use the lookup.
Key: a † after a ZIP means it has no mapped community water system — usually a private-well area. Plain ZIPs are served by a mapped community water system.
McLean County · 437 mg/L · Very hard
423224232742350†42352†42371†42372†
Jefferson County · 395 mg/L · Very hard
4002340025400414011840202402034020440205402064020740208402094021040211402124021340214402154021640217402184021940220402214022240223402284022940231402414024240243402454025840272402804029140299
Taylor County · 315 mg/L · Very hard
4271842733†42758
Trimble County · 300 mg/L · Very hard
40006†4004540055
Metcalfe County · 295 mg/L · Very hard
4212442129†42154†4216642214
Meade County · 290 mg/L · Very hard
40104†4010840117†40142†4015540157†40161†40175
Campbell County · 280 mg/L · Very hard
410014100741059410714107341074410754107641085
Hopkins County · 254.5 mg/L · Very hard
424084241042413†42431424364244042441†424424245342464†
Breathitt County · 253 mg/L · Very hard
41310†41317†41339†4134841366†41385†41390
Breckinridge County · 246 mg/L · Very hard
40111†40115†40119†4014040143†40144†40145†401464015240170†40171†40176†40178
Oldham County · 240 mg/L · Very hard
40010400144002640031†400564005940077
Anderson County · 226 mg/L · Very hard
40342
Shelby County · 220 mg/L · Very hard
40003†40022†400654006740076†
Grant County · 215.5 mg/L · Very hard
41010†410304103541052†41097†
Robertson County · 211 mg/L · Very hard
41064
Woodford County · 210 mg/L · Very hard
40347†40383†
Bourbon County · 207.5 mg/L · Very hard
403484035740361†
Crittenden County · 205.5 mg/L · Very hard
4203742064
Spencer County · 203 mg/L · Very hard
40046†40071†
Christian County · 200 mg/L · Very hard
42215422174223242236†4224042254†4226242266
Hardin County · 199 mg/L · Very hard
401214016040162427014271242724†4273242740†42776†42788
Bullitt County · 197 mg/L · Very hard
400474010940110401504016540177
Washington County · 196.5 mg/L · Very hard
40040†400614006940078
Nelson County · 195 mg/L · Very hard
40004400084001240013†40020400514005240107†
Caldwell County · 190 mg/L · Very hard
42411†42445
Logan County · 184 mg/L · Very hard
422024220642256†42265†42276
Barren County · 181 mg/L · Very hard
42123421274213042131†42141†42156
Daviess County · 180 mg/L · Very hard
42301†42303423554235642366†42376†
Floyd County · 179.5 mg/L · Hard
41216†416014160241603416044160541606†4160741612†416154161641619416214162241630†4163141635†41636†41642†416454164741649†416504165141653†41655†4166041663416664166741669
Pike County · 177 mg/L · Hard
4150141503†4151241513415144151941522†41524†4152641527415284153141534†4153541538†41539†41540†415434154441547†4154841553†41554†4155541557†41558†4155941560†4156241563415644156641567†41568†41571†4157241659†
Madison County · 164 mg/L · Hard
40385404034040440475
Owen County · 163 mg/L · Hard
40355†403594036341046†41098
Fulton County · 160 mg/L · Hard
4204142050†
Larue County · 160 mg/L · Hard
4271642748†
Martin County · 160 mg/L · Hard
4120341214†41224†4123141250†41262†41267†
Warren County · 159 mg/L · Hard
42101†421034210442122†42159†4217042171†42274
Marion County · 157.5 mg/L · Hard
40009400334003740049†40060†4006240063†40328
Grayson County · 155 mg/L · Hard
42721427264275442762
Garrard County · 151 mg/L · Hard
40444†40461
Union County · 150.1 mg/L · Hard
4243742459†42461†42462†
Bath County · 149 mg/L · Hard
40334†40358†4036040371†40374†
Trigg County · 149 mg/L · Hard
42211†
Estill County · 148.5 mg/L · Hard
4033640472
Leslie County · 145 mg/L · Hard
40803†40808†40816†40827†4084040844†408584086840874†40979†41714†4174941762†41764†4176641775†41776†41777†
Green County · 144 mg/L · Hard
42743†4276442782
Gallatin County · 141 mg/L · Hard
41086†41095†
Clinton County · 140 mg/L · Hard
42602
Henderson County · 140 mg/L · Hard
4240642420†42451†42452†42458
Muhlenberg County · 140 mg/L · Hard
4232142323423244232542326†423304233242337†42339†4234442345†4236742374
Webster County · 140 mg/L · Hard
42404424094244442450424554245642463†
Boone County · 139.6 mg/L · Hard
41005†410424104841080†4109141092†41094
Butler County · 136 mg/L · Hard
4225242261†42273†42275†
Bracken County · 134 mg/L · Hard
4100241004†41043
Cumberland County · 132 mg/L · Hard
42717†42759
Hart County · 130 mg/L · Hard
427134272242729†4274642749†42757†4276542784†
Henry County · 130 mg/L · Hard
40007†40011400194003640050†4005740058400684007040075†
Hancock County · 128.5 mg/L · Hard
4234842351†42368
Lawrence County · 128 mg/L · Hard
41124†41159†41180†412014123041232†41264
Allen County · 120 mg/L · Hard
4212042153†42164
Boyd County · 120 mg/L · Hard
41101411024112941168†
Franklin County · 110 mg/L · Moderately hard
40601†
Pendleton County · 110 mg/L · Moderately hard
4100641033†41040†
Greenup County · 109 mg/L · Moderately hard
4112141139411444116941174†41175†41183
Harrison County · 108.5 mg/L · Moderately hard
4100341031
Ballard County · 104 mg/L · Moderately hard
4202242024†4205342056†42060†42087†
Knox County · 103 mg/L · Moderately hard
40734†40771†4090340906409154092140923†4093540943409464094940953†40982†4099540997†
Ohio County · 103 mg/L · Moderately hard
42320†42328†42333†42338423434234742349†4235442361423694237042378†
Elliott County · 100 mg/L · Moderately hard
4114941171
Johnson County · 100 mg/L · Moderately hard
4120441219†412224122641234412384124041254†412554125641257412604126341265†412684127141274†
Lee County · 100 mg/L · Moderately hard
4131141397
Clay County · 98 mg/L · Moderately hard
409144094140962†40972
Livingston County · 98 mg/L · Moderately hard
42028†4204542047†4205842078†4208142083
Wayne County · 98 mg/L · Moderately hard
42518†4260342633†
Carter County · 97 mg/L · Moderately hard
4113241142†4114341146†4116441181†
Rockcastle County · 95.8 mg/L · Moderately hard
40409†40445†4045640460†
Casey County · 95.5 mg/L · Moderately hard
40437†4251642528†42539†425414256542566†
Lyon County · 95.5 mg/L · Moderately hard
4203842055†
Letcher County · 94 mg/L · Moderately hard
40826†40862†4151741537†418044181041812†4181541819†41821†4182441825418264183241833†418354183741838†4184041845†41848†418494185541858
Pulaski County · 92 mg/L · Moderately hard
4250142503425194253342544†4255342567
Edmonson County · 90.8 mg/L · Moderately hard
42160†4216342207†4221042259†42285†
Powell County · 90 mg/L · Moderately hard
403124037640380
Fleming County · 89 mg/L · Moderately hard
410394104141049†41093†
Morgan County · 87.6 mg/L · Moderately hard
41332413524140841421†4142541472
Owsley County · 81.9 mg/L · Moderately hard
40983†41314413514136441386†
Monroe County · 81.3 mg/L · Moderately hard
42133421404215142157†42167
Adair County · 80.8 mg/L · Moderately hard
427154272842741†4274242753†
Jackson County · 79.8 mg/L · Moderately hard
4040240434404474048140486
Russell County · 76.7 mg/L · Moderately hard
4262942642†
Rowan County · 75.2 mg/L · Moderately hard
40313†40351
Whitley County · 73.3 mg/L · Moderately hard
407014075940763†40769†
Laurel County · 71.8 mg/L · Moderately hard
40729†40737407404074140744†
McCracken County · 65.5 mg/L · Moderately hard
4200142003†42086
McCreary County · 64 mg/L · Moderately hard
4263142634†426354263842647†4264942653†
Marshall County · 62 mg/L · Moderately hard
42025420294204442048
Menifee County · 62 mg/L · Moderately hard
40316†4032240346†40387
Harlan County · 59 mg/L · Soft
40801408064080740810†4081540818†40819†4082040823†40824†40828†40829†4083040831†40843†40847408494085440855†40863†40865†4087040873†40927†40964†
Magoffin County · 55 mg/L · Soft
4146441465†41632†
Bell County · 49 mg/L · Soft
40813†40845408564090240913†409394094040958†409654097740988†
Lewis County · 46.1 mg/L · Soft
4113541141†41166†41179†41189†
Wolfe County · 44 mg/L · Soft
4130141360†41365
Hickman County · 34 mg/L · Soft
42031†42032
Carlisle County · 33.8 mg/L · Soft
42021†42023†42035†
Calloway County · 31 mg/L · Soft
4202042036†42049†42054†42071†42076†
Graves County · 23.5 mg/L · Soft
42027†42039†42040†42051420614206642069†42079420824208542088†
† 272 ZIP codes are not served by a mapped community water system — most are private-well areas. See well water hardness.
Source
Groundwater vs surface water
Kentucky's groundwater measures harder than its surface water — 230 mg/L across 4,408 samples versus 116 across 24,075, about 2× harder. Wells draw from groundwater, so well owners in Kentucky tend to see the harder number — 230 mg/L, very hard. Groundwater readings there run 27 to 705 mg/L across the middle 80% of samples. The comparison draws on 2,985 groundwater and 1,426 surface-water monitoring sites; 206 readings above 2,000 mg/L were logged but held out of the medians as outliers.
Groundwater (wells)
230 mg/L as CaCO₃ · 4,408 results at 2,985 stations.
Surface water (rivers, lakes)
116 mg/L as CaCO₃ · 24,075 results at 1,426 stations.
Groundwater measures about 2× harder than surface water here.
Chemistry
Water chemistry in Kentucky
Beyond the hardness number, Kentucky's water carries a fuller chemical signature — here is how its measured parameters compare to national benchmarks.
TDS
148 mg/L · n=2,425
148 mg/L — below the national county median of 226.
pH
7.7 pH · n=3,276
pH 7.7 — within the EPA secondary range of 6.5–8.5, on the alkaline side.
Alkalinity
60 mg/L as CaCO3 · n=4,188
60 mg/L — modest buffering capacity.
Calcium : Magnesium
32.4 : 8 mg/L ≈ 4.05 : 1 · n=11,904
Calcium is about 71% of Kentucky's hardness (32.4 mg/L Ca to 8 mg/L Mg), a little more calcium-rich than the national ~68% calcium share.
Parameter medians may include a small share of quality-control samples; the hardness lane is fully QC-filtered.
Aquifers
Major aquifers under Kentucky
One aquifer system supply much of Kentucky's measured groundwater.
- Alluvial aquifers — median 322 mg/L across 37 samples at 24 sites: very hard.
Together these systems account for 37 measured samples at 24 sites. Aquifer medians pool samples across a whole system and can mask local variation — see the national aquifer map for how these compare across states.
Trend
Hardness over time
Kentucky's decade median moved from 410 mg/L in the 1940s to 118 in the 2020s. Over the series, the decade median peaked at 410 mg/L in the 1940s and bottomed at 71 in the 1990s. Decade medians reflect where and what agencies sampled in each era, not just changes in the water itself.
Scale
Where Kentucky sits on the scale
On the USGS scale, Kentucky's 120 mg/L is hard — 7 grains per gallon, above the 120 mg/L hard cutoff, below very hard.
At 120 mg/L (7 gpg), water-softener owners in Kentucky typically set their unit to this hardness — settings calculator.
Questions
Frequently asked questions
- Is Kentucky's water hard?
- Kentucky's median hardness is 120 mg/L as CaCO₃, "hard" on the USGS scale and below the national county median of 140 mg/L. About 74% of residents in measured counties have hard-or-worse water.
- Which county in Kentucky has the hardest water?
- McLean County, with a median of 437 mg/L as CaCO₃ across 42 measurements.
- Is well water harder than city water in Kentucky?
- Groundwater measures harder here — about 2× the surface water — so wells tend to run harder (groundwater 230 vs surface water 116 mg/L).
- How do I find my exact hardness in Kentucky?
- Search your ZIP on the lookup tool, read your utility's Consumer Confidence Report, or test at home with a kit.
- Is Kentucky's water harder than the national average?
- No. Kentucky's median of 120 mg/L is below the national county median of 140 mg/L; it ranks #24 of the 50 states and D.C.
Compare
States with similar hardness
Two states measure closest to Kentucky's 120 mg/L: District of Columbia at 113 mg/L and Idaho at 130 mg/L. Kentucky measures harder than 54% of states. Browse the full ranking on the statistics page.
More: hardness scale · check your address · national statistics · the national map.
By Marko Visic, MPharm, BSc Physics. Source: USGS/EPA Water Quality Portal — 28,806 Kentucky measurements. Data last verified . Methodology.
Cite this page: “Kentucky Water Hardness by County.” Hard Water Map. Retrieved 2026-07-22, https://hardwatermap.com/water-hardness/kentucky/