Mississippi Water Hardness by County
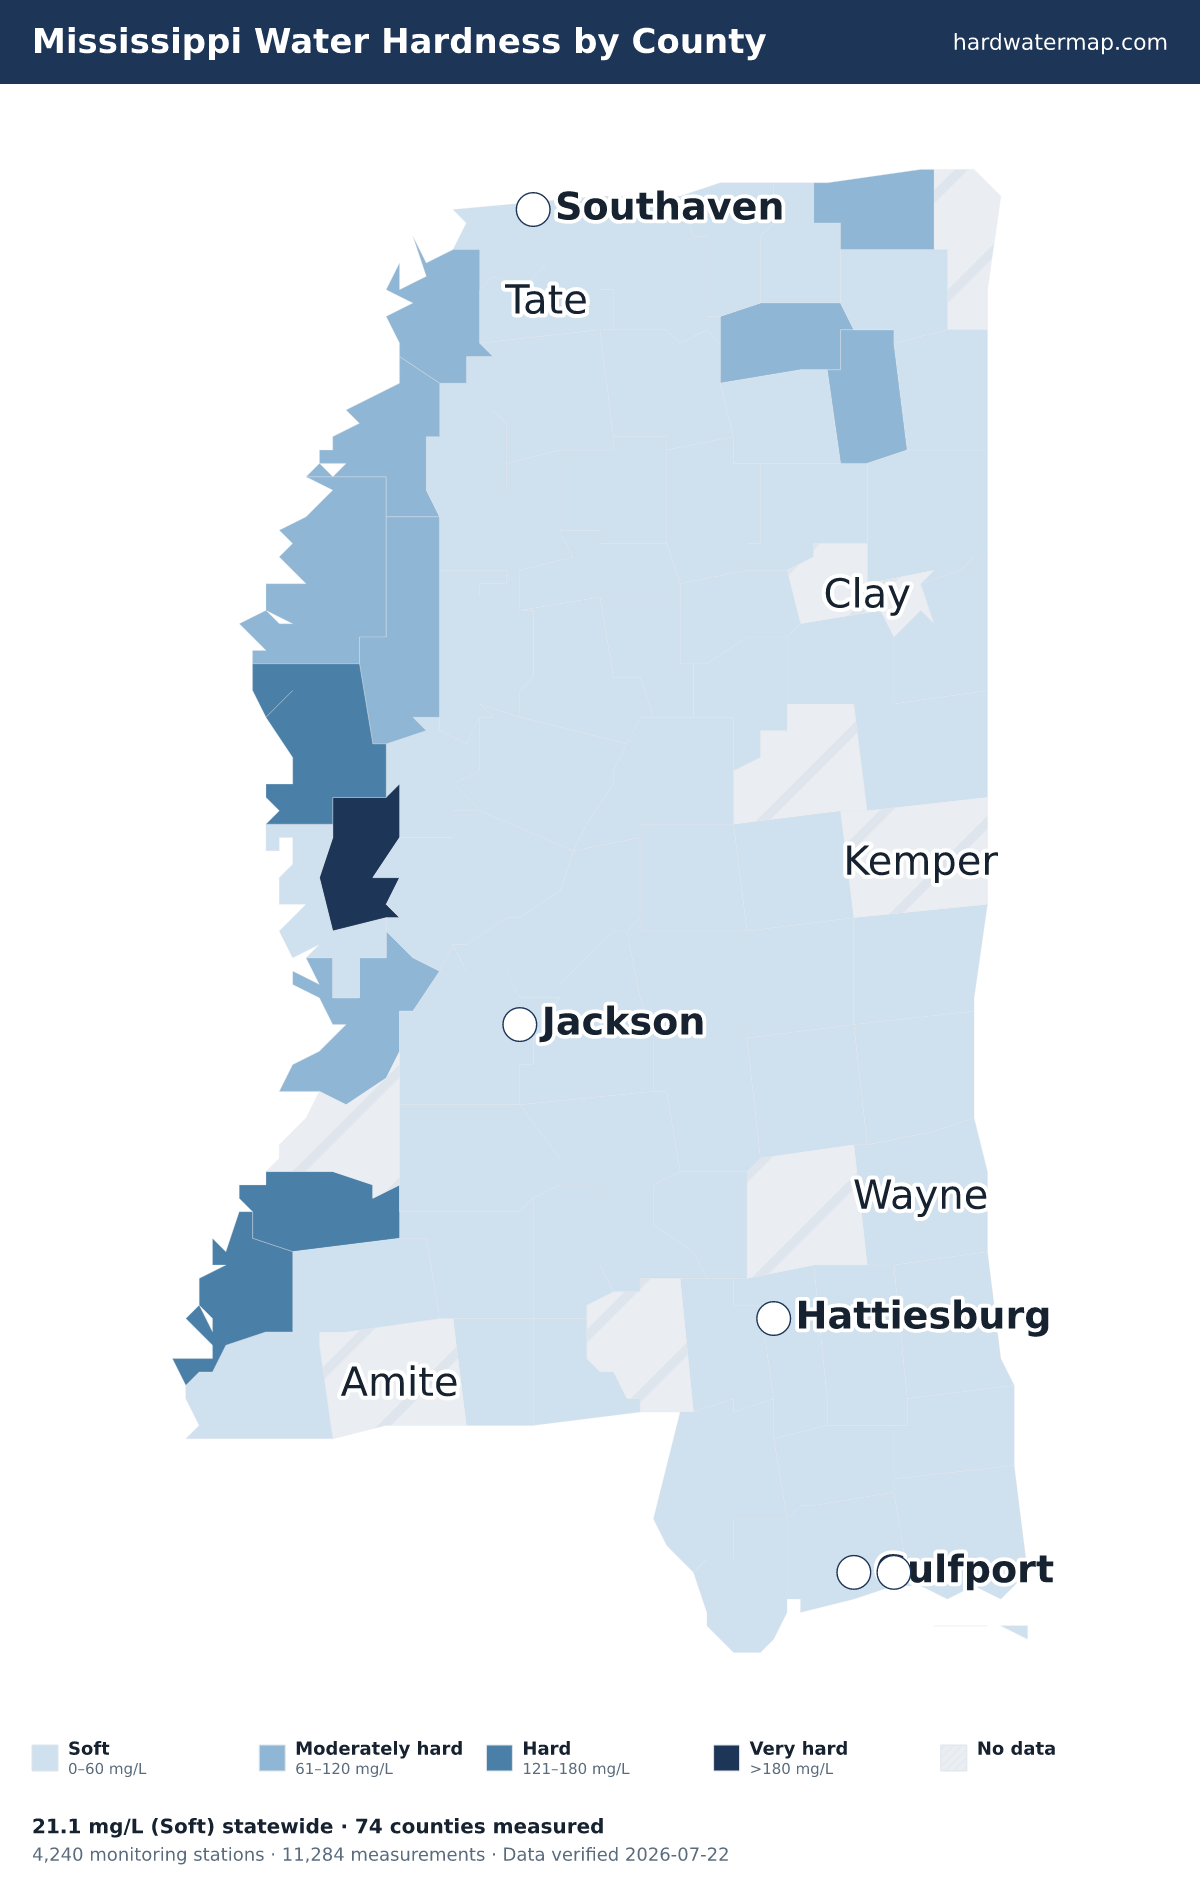
Water in Mississippi has a median hardness of 21.1 mg/L as CaCO₃ — "soft" on the USGS scale — based on 11,284 measurements at 4,240 monitoring stations. Sharkey County has the state's hardest measured water (224 mg/L); Wilkinson County the softest (0.8). Rank: #48 of the 50 states and D.C.
Mississippi water hardness map — what the numbers mean. Data verified 2026-07-22.
Of Mississippi's 74 measured counties, 1 very hard, 3 hard, 8 moderately hard, and 62 soft. The hardest are Sharkey County (224 mg/L), Adams County (160), and Jefferson County (160). Wilkinson County is the softest at 0.8 mg/L (soft).
About 3% of Mississippi's roughly 2.8 million residents in counties with gate-passing hardness data live where tap water is hard or worse.
Statewide, Mississippi's median works out to 1.2 grains per gallon and ranks #48 of the 50 states and D.C. Across 11,284 measurements at 4,240 stations — 2,032 of them since 2000 — the middle 80% of readings fall between 3 and 152 mg/L. The public record runs from 1911 to 2025.
See where Mississippi sits nationally on the national map, or what its number means on the hardness scale.
Download the Mississippi water hardness map (PNG) — Water hardness by county in Mississippi: 74 counties mapped from USGS/EPA data, statewide median 21.1 mg/L (soft); darker counties have harder water.
By county
Water hardness by county
The table lists all 74 measured Mississippi counties, hardest first. Their medians span 224 mg/L in Sharkey County to 0.8 in Wilkinson County — a 280× range. 8 more Mississippi counties lack gate-passing data.
| County | Median | Band | Results | Sites | Newest |
|---|---|---|---|---|---|
| Sharkey County | 224 | Very hard | 45 | 31 | 2017 |
| Adams County | 160 | Hard | 114 | 74 | 2013 |
| Jefferson County | 160 | Hard | 55 | 17 | 2004 |
| Washington County | 122 | Hard | 747 | 200 | 2023 |
| Coahoma County | 117.5 | Moderately hard | 54 | 32 | 2019 |
| Tunica County | 98.5 | Moderately hard | 54 | 19 | 2007 |
| Sunflower County | 90.1 | Moderately hard | 67 | 38 | 2020 |
| Alcorn County | 86 | Moderately hard | 125 | 94 | 2004 |
| Lee County | 83 | Moderately hard | 196 | 182 | 2019 |
| Warren County | 81.8 | Moderately hard | 895 | 32 | 2023 |
| Bolivar County | 76.2 | Moderately hard | 215 | 42 | 2019 |
| Union County | 66.5 | Moderately hard | 28 | 24 | 2013 |
| Pontotoc County | 58.5 | Soft | 26 | 26 | 2013 |
| Prentiss County | 48 | Soft | 71 | 37 | 2013 |
| Wayne County | 45 | Soft | 136 | 52 | 2005 |
| Calhoun County | 42.1 | Soft | 112 | 56 | 2022 |
| Newton County | 41 | Soft | 44 | 41 | 2014 |
| Monroe County | 40 | Soft | 219 | 69 | 2019 |
| Quitman County | 38 | Soft | 45 | 28 | 1996 |
| Lowndes County | 36.4 | Soft | 208 | 49 | 2025 |
| Issaquena County | 35.9 | Soft | 23 | 16 | 2018 |
| Scott County | 34.5 | Soft | 61 | 32 | 2005 |
| Attala County | 33 | Soft | 37 | 29 | 2014 |
| Chickasaw County | 30 | Soft | 47 | 25 | 2005 |
| Holmes County | 29.7 | Soft | 84 | 38 | 2019 |
| DeSoto County | 28.5 | Soft | 44 | 32 | 2019 |
| Jasper County | 27 | Soft | 53 | 48 | 2014 |
| Oktibbeha County | 26.5 | Soft | 42 | 35 | 2013 |
| Yazoo County | 26 | Soft | 61 | 49 | 2019 |
| Tippah County | 25.8 | Soft | 43 | 22 | 2013 |
| Itawamba County | 25 | Soft | 104 | 34 | 2019 |
| Leflore County | 25 | Soft | 279 | 55 | 2020 |
| Noxubee County | 25 | Soft | 81 | 51 | 2013 |
| Webster County | 25 | Soft | 47 | 33 | 2013 |
| Hinds County | 24 | Soft | 293 | 99 | 2014 |
| Neshoba County | 22.4 | Soft | 65 | 39 | 2018 |
| Panola County | 22 | Soft | 45 | 32 | 2019 |
| Lauderdale County | 21.7 | Soft | 126 | 65 | 2005 |
| Greene County | 20 | Soft | 104 | 41 | 2013 |
| Madison County | 20 | Soft | 56 | 40 | 2014 |
| Carroll County | 19 | Soft | 43 | 27 | 2007 |
| Clarke County | 19 | Soft | 119 | 52 | 2018 |
| Montgomery County | 19 | Soft | 39 | 28 | 2022 |
| Lafayette County | 18.5 | Soft | 41 | 32 | 2022 |
| Lawrence County | 18 | Soft | 91 | 16 | 2005 |
| Tallahatchie County | 18 | Soft | 24 | 23 | 2014 |
| Choctaw County | 17.5 | Soft | 38 | 33 | 2018 |
| Copiah County | 17.5 | Soft | 90 | 31 | 2005 |
| Grenada County | 16.2 | Soft | 43 | 31 | 2022 |
| George County | 16 | Soft | 435 | 34 | 2009 |
| Pearl River County | 16 | Soft | 161 | 52 | 2024 |
| Lincoln County | 15.6 | Soft | 118 | 85 | 2005 |
| Leake County | 15.5 | Soft | 82 | 25 | 2018 |
| Smith County | 15.5 | Soft | 64 | 42 | 2014 |
| Yalobusha County | 15 | Soft | 55 | 33 | 2022 |
| Tate County | 14.9 | Soft | 55 | 18 | 2019 |
| Jackson County | 14.7 | Soft | 637 | 287 | 2021 |
| Humphreys County | 14.5 | Soft | 28 | 22 | 2019 |
| Marshall County | 14.5 | Soft | 35 | 21 | 2022 |
| Forrest County | 14.4 | Soft | 194 | 84 | 2013 |
| Franklin County | 14 | Soft | 215 | 36 | 2002 |
| Benton County | 13.8 | Soft | 43 | 27 | 2022 |
| Rankin County | 12 | Soft | 92 | 63 | 2018 |
| Covington County | 10 | Soft | 49 | 25 | 2013 |
| Simpson County | 10 | Soft | 41 | 24 | 2013 |
| Jefferson Davis County | 9.5 | Soft | 26 | 17 | 2013 |
| Pike County | 8.5 | Soft | 66 | 43 | 2013 |
| Lamar County | 8 | Soft | 339 | 258 | 2009 |
| Walthall County | 8 | Soft | 51 | 17 | 2013 |
| Stone County | 6 | Soft | 32 | 26 | 2009 |
| Harrison County | 5 | Soft | 541 | 210 | 2019 |
| Perry County | 2.8 | Soft | 565 | 86 | 2009 |
| Hancock County | 1 | Soft | 357 | 55 | 2020 |
| Wilkinson County | 0.8 | Soft | 169 | 30 | 2005 |
ZIP codes
ZIP codes in Mississippi
The ZIP codes below are grouped by the Mississippi county each mostly falls within (by land area). Each ZIP takes that county's measured median — shown in the group header — so this is a ZIP-to-county guide, not a separate reading for every ZIP. To check the water system serving a specific address, use the lookup.
Key: a † after a ZIP means it has no mapped community water system — usually a private-well area. Plain ZIPs are served by a mapped community water system.
Sharkey County · 224 mg/L · Very hard
38721†38765†39054†3906139088†39159†
Adams County · 160 mg/L · Hard
39120†
Jefferson County · 160 mg/L · Hard
3906939096†39668†
Washington County · 122 mg/L · Hard
38701†38703†38722†38723†38731†3874438748†3875638760†38776
Coahoma County · 117.5 mg/L · Moderately hard
38614†38617†38631†386393864438645†3872038767
Tunica County · 98.5 mg/L · Moderately hard
386263866438676†
Sunflower County · 90.1 mg/L · Moderately hard
38736†38737†38738†3875138753†38761†3876838771†38778†
Alcorn County · 86 mg/L · Moderately hard
38834†38846†38865
Lee County · 83 mg/L · Moderately hard
38801†3880438849†38857†3886238866†38868†38879
Warren County · 81.8 mg/L · Moderately hard
39156†3918039183†
Bolivar County · 76.2 mg/L · Moderately hard
38725†38726†38730387323873338740†38746†38759†38762†38764†38769†38772†387733877438781†
Union County · 66.5 mg/L · Moderately hard
38650†3865238828
Pontotoc County · 58.5 mg/L · Soft
3882638841†38863†38864†3886938871
Prentiss County · 48 mg/L · Soft
388243882938859
Wayne County · 45 mg/L · Soft
393223932439367
Calhoun County · 42.1 mg/L · Soft
3883938878†3891338914389153891638951†
Newton County · 41 mg/L · Soft
3905739323†39327†3933239336†3933739345†
Monroe County · 40 mg/L · Soft
3882138844†38848†3887039730†39746
Quitman County · 38 mg/L · Soft
3862338643†3864638670†38964†
Lowndes County · 36.4 mg/L · Soft
39701†39702397053973639740†397433975339766†
Issaquena County · 35.9 mg/L · Soft
387453911339177†
Scott County · 34.5 mg/L · Soft
39074†3909239117†39359
Attala County · 33 mg/L · Soft
390673907939090391083916039192†39745†
Chickasaw County · 30 mg/L · Soft
38850†38851†38860†39776†
Holmes County · 29.7 mg/L · Soft
38924†39063†39095†39169
DeSoto County · 28.5 mg/L · Soft
38632†38637386413865138654†38671†3867238680
Jasper County · 27 mg/L · Soft
39338†39347†39348393563942239439†39481
Oktibbeha County · 26.5 mg/L · Soft
3975939762†39769
Yazoo County · 26 mg/L · Soft
39039†3904039162†39173†3917939194†
Tippah County · 25.8 mg/L · Soft
386103862538629†386633867438683
Itawamba County · 25 mg/L · Soft
38843†38847†3885538856†38858†38876†
Leflore County · 25 mg/L · Soft
38930†38941†38944†389463895238954†
Noxubee County · 25 mg/L · Soft
39341†3936139739
Webster County · 25 mg/L · Soft
397373974439750†397513976739771
Hinds County · 24 mg/L · Soft
39041†39056†3905839066†391543917039175392013920239203392043920639209†3921039211392123921339216392173926939272
Neshoba County · 22.4 mg/L · Soft
3935039365
Panola County · 22 mg/L · Soft
38606†38619†38620†3862138622†3865838666†
Lauderdale County · 21.7 mg/L · Soft
39301393053930739309†39320†3932539335†39342†39364†
Greene County · 20 mg/L · Soft
393623945139456†39461
Madison County · 20 mg/L · Soft
39045390463907139110391463915739174
Carroll County · 19 mg/L · Soft
3891738923389433894739176
Clarke County · 19 mg/L · Soft
39330†39355†39360†39363†39366†
Montgomery County · 19 mg/L · Soft
38925†3896739747†
Lafayette County · 18.5 mg/L · Soft
38601†38627†3865538673†3867738949
Lawrence County · 18 mg/L · Soft
396413965439663†39665
Tallahatchie County · 18 mg/L · Soft
389203892138927†38928†3895038953†38957†3896238963†38966†
Choctaw County · 17.5 mg/L · Soft
3973539752†39772†
Copiah County · 17.5 mg/L · Soft
3905939078†39083†39191†
Grenada County · 16.2 mg/L · Soft
389013892938940
George County · 16 mg/L · Soft
39452†
Pearl River County · 16 mg/L · Soft
3942639466†39470†
Lincoln County · 15.6 mg/L · Soft
3960139629†39662
Leake County · 15.5 mg/L · Soft
39051†3909439189
Smith County · 15.5 mg/L · Soft
39116391523915339168†
Yalobusha County · 15 mg/L · Soft
3892238948†3896138965†
Tate County · 14.9 mg/L · Soft
38618†38665†38668†
Jackson County · 14.7 mg/L · Soft
3955339562†39563†39564†39565†3956739581†39595†
Humphreys County · 14.5 mg/L · Soft
38754†39038†39097†39115†39166†
Marshall County · 14.5 mg/L · Soft
3861138635†3865938661†38685†
Forrest County · 14.4 mg/L · Soft
3940139406†39465
Franklin County · 14 mg/L · Soft
3963039647†39653†39661†
Benton County · 13.8 mg/L · Soft
38603†38633†38642†38647†
Rankin County · 12 mg/L · Soft
39042†3904739073†3914539148†3916739193†39208†3921839232
Covington County · 10 mg/L · Soft
39119†3942839479†
Simpson County · 10 mg/L · Soft
390443906239082†391113911439149†
Jefferson Davis County · 9.5 mg/L · Soft
39140†39421394273947439656
Pike County · 8.5 mg/L · Soft
3963539648†39652†39657†39666
Lamar County · 8 mg/L · Soft
39402394553947539482
Walthall County · 8 mg/L · Soft
39667†
Stone County · 6 mg/L · Soft
3956139573†39577†
Harrison County · 5 mg/L · Soft
3950139503†395073953039531†395323953439540†3956039571†39574†
Perry County · 2.8 mg/L · Soft
39423†39425†39462†39476†
Hancock County · 1 mg/L · Soft
39520†3952539529†39556†39572†39576
Wilkinson County · 0.8 mg/L · Soft
3963139633†39669
† 200 ZIP codes are not served by a mapped community water system — most are private-well areas. See well water hardness.
Source
Groundwater vs surface water
Mississippi's surface water measures harder than its groundwater — 25.5 mg/L across 5,668 samples versus 20 across 4,978, about 1.3× harder. For well owners that is the better side of a hard bargain: at 20 mg/L, Mississippi groundwater is still soft, and most of the state's drinking water is pumped from it. Groundwater readings there run 3 to 219.9 mg/L across the middle 80% of samples. The comparison draws on 3,664 groundwater and 573 surface-water monitoring sites; 73 readings above 2,000 mg/L were logged but held out of the medians as outliers.
Groundwater (wells)
20 mg/L as CaCO₃ · 4,978 results at 3,664 stations.
Surface water (rivers, lakes)
25.5 mg/L as CaCO₃ · 5,668 results at 573 stations.
Surface water measures about 1.3× harder than groundwater here.
Chemistry
Water chemistry in Mississippi
Beyond the hardness number, Mississippi's water carries a fuller chemical signature — here is how its measured parameters compare to national benchmarks.
TDS
154 mg/L · n=2,161
154 mg/L — below the national county median of 226.
pH
7.5 pH · n=1,924
pH 7.5 — within the EPA secondary range of 6.5–8.5, on the alkaline side.
Alkalinity
75 mg/L as CaCO3 · n=2,791
75 mg/L — modest buffering capacity.
Calcium : Magnesium
25.4 : 7.3 mg/L ≈ 3.48 : 1 · n=1,521
Calcium is about 68% of Mississippi's hardness (25.4 mg/L Ca to 7.3 mg/L Mg), a little in line with than the national ~68% calcium share.
Parameter medians may include a small share of quality-control samples; the hardness lane is fully QC-filtered.
Aquifers
Major aquifers under Mississippi
3 aquifer systems supply much of Mississippi's measured groundwater.
- Mississippi River Valley alluvial aquifer — median 346 mg/L across 363 samples at 214 sites: very hard.
- Southeastern Coastal Plain aquifer system — median 41 mg/L across 1,146 samples at 781 sites: soft.
- Mississippi embayment aquifer system — median 12 mg/L across 1,276 samples at 1,109 sites: soft.
Together these systems account for 2,785 measured samples at 2,104 sites. Aquifer medians pool samples across a whole system and can mask local variation — see the national aquifer map for how these compare across states.
Trend
Hardness over time
Mississippi's decade median moved from 15 mg/L in the 1910s to 74.8 in the 2020s. Over the series, the decade median peaked at 86.1 mg/L in the 2010s and bottomed at 10 in the 1940s. Decade medians reflect where and what agencies sampled in each era, not just changes in the water itself.
Scale
Where Mississippi sits on the scale
On the USGS scale, Mississippi's 21.1 mg/L is soft — 1.2 grains per gallon, below the 60 mg/L soft cutoff — among the softest water measured in the US.
Questions
Frequently asked questions
- Is Mississippi's water hard?
- Mississippi's median hardness is 21.1 mg/L as CaCO₃, "soft" on the USGS scale and below the national county median of 140 mg/L.
- Which county in Mississippi has the hardest water?
- Sharkey County, with a median of 224 mg/L as CaCO₃ across 45 measurements.
- Is well water harder than city water in Mississippi?
- Surface water measures harder here — about 1.3× the groundwater — so wells tend to run softer (groundwater 20 vs surface water 25.5 mg/L).
- How do I find my exact hardness in Mississippi?
- Search your ZIP on the lookup tool, read your utility's Consumer Confidence Report, or test at home with a kit.
- Is Mississippi's water harder than the national average?
- No. Mississippi's median of 21.1 mg/L is below the national county median of 140 mg/L; it ranks #48 of the 50 states and D.C.
Compare
States with similar hardness
Two states measure closest to Mississippi's 21.1 mg/L: Rhode Island at 20.2 mg/L and New Hampshire at 22.9 mg/L. Mississippi measures harder than 6% of states. Browse the full ranking on the statistics page.
More: hardness scale · check your address · national statistics · the national map.
By Marko Visic, MPharm, BSc Physics. Source: USGS/EPA Water Quality Portal — 11,284 Mississippi measurements. Data last verified . Methodology.
Cite this page: “Mississippi Water Hardness by County.” Hard Water Map. Retrieved 2026-07-22, https://hardwatermap.com/water-hardness/mississippi/