Missouri Water Hardness by County
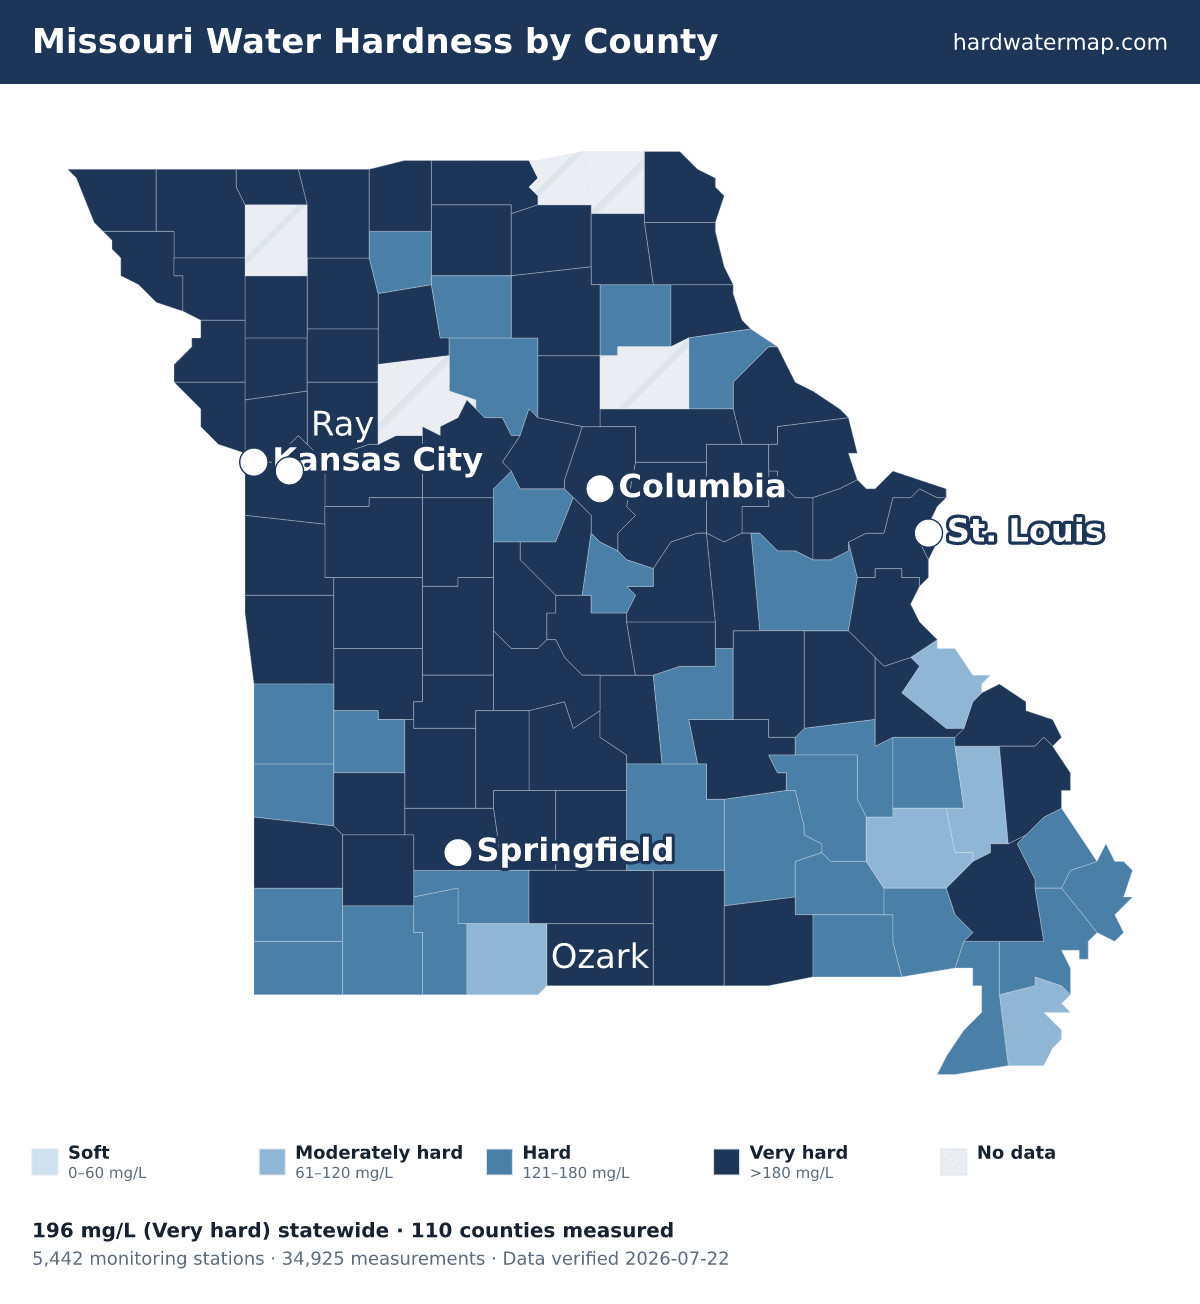
Water in Missouri has a median hardness of 196 mg/L as CaCO₃ — "very hard" on the USGS scale — based on 34,925 measurements at 5,442 monitoring stations. Clay County has the state's hardest measured water (514.5 mg/L); Pemiscot County the softest (62.3). Rank: #15 of the 50 states and D.C.
Missouri water hardness map — what the numbers mean. Data verified 2026-07-22.
Of Missouri's 110 measured counties, 76 very hard, 29 hard, and 5 moderately hard. The hardest are Clay County (514.5 mg/L), Henry County (446), and Randolph County (430). Pemiscot County is the softest at 62.3 mg/L (moderately hard).
About 98% of Missouri's roughly 6.1 million residents in counties with gate-passing hardness data live where tap water is hard or worse.
Statewide, Missouri's median works out to 11.4 grains per gallon and ranks #15 of the 50 states and D.C. Across 34,925 measurements at 5,442 stations — 17,042 of them since 2000 — the middle 80% of readings fall between 108 and 394 mg/L. The public record runs from 1901 to 2026.
See where Missouri sits nationally on the national map, or what its number means on the hardness scale.
Download the Missouri water hardness map (PNG) — Water hardness by county in Missouri: 110 counties mapped from USGS/EPA data, statewide median 196 mg/L (very hard); darker counties have harder water.
By county
Water hardness by county
The table lists all 110 measured Missouri counties, hardest first. Their medians span 514.5 mg/L in Clay County to 62.3 in Pemiscot County — a 8.3× range. 5 more Missouri counties lack gate-passing data.
| County | Median | Band | Results | Sites | Newest |
|---|---|---|---|---|---|
| Clay County | 514.5 | Very hard | 132 | 45 | 2025 |
| Henry County | 446 | Very hard | 435 | 86 | 2026 |
| Randolph County | 430 | Very hard | 499 | 44 | 2025 |
| Boone County | 400 | Very hard | 1,881 | 134 | 2025 |
| St. Francois County | 321 | Very hard | 803 | 142 | 2026 |
| Audrain County | 290 | Very hard | 39 | 32 | 2013 |
| Callaway County | 290 | Very hard | 173 | 63 | 2025 |
| Saline County | 280 | Very hard | 110 | 76 | 2025 |
| Ray County | 275 | Very hard | 45 | 26 | 2014 |
| Atchison County | 270 | Very hard | 38 | 25 | 2007 |
| Howard County | 270 | Very hard | 14 | 13 | 2023 |
| St. Clair County | 270 | Very hard | 85 | 23 | 2024 |
| Clinton County | 268.5 | Very hard | 24 | 15 | 2013 |
| Jackson County | 260 | Very hard | 1,559 | 244 | 2025 |
| Buchanan County | 255 | Very hard | 416 | 24 | 2023 |
| Caldwell County | 254 | Very hard | 45 | 14 | 2013 |
| Clark County | 250 | Very hard | 369 | 35 | 2023 |
| St. Charles County | 250 | Very hard | 847 | 276 | 2026 |
| Gasconade County | 240 | Very hard | 24 | 22 | 2024 |
| Washington County | 240 | Very hard | 395 | 74 | 2026 |
| Lafayette County | 237 | Very hard | 35 | 28 | 2023 |
| St. Louis County | 231.5 | Very hard | 1,731 | 194 | 2026 |
| Perry County | 231 | Very hard | 263 | 30 | 2024 |
| Holt County | 230 | Very hard | 407 | 44 | 2026 |
| Daviess County | 226.5 | Very hard | 84 | 24 | 2015 |
| Camden County | 225 | Very hard | 279 | 42 | 2025 |
| St. Louis County | 225 | Very hard | 49 | 2 | 2011 |
| Benton County | 224.5 | Very hard | 54 | 17 | 2022 |
| Cass County | 220.5 | Very hard | 112 | 33 | 2025 |
| Miller County | 220 | Very hard | 98 | 22 | 2025 |
| Montgomery County | 219 | Very hard | 641 | 22 | 2025 |
| DeKalb County | 217 | Very hard | 46 | 19 | 2014 |
| Worth County | 216 | Very hard | 67 | 11 | 2021 |
| Harrison County | 215 | Very hard | 139 | 27 | 2023 |
| Moniteau County | 215 | Very hard | 59 | 17 | 2022 |
| Hickory County | 213.5 | Very hard | 76 | 23 | 2025 |
| Greene County | 213 | Very hard | 557 | 131 | 2023 |
| Warren County | 211.5 | Very hard | 74 | 27 | 2026 |
| Jefferson County | 211 | Very hard | 731 | 142 | 2023 |
| Johnson County | 210 | Very hard | 86 | 49 | 2025 |
| Nodaway County | 210 | Very hard | 83 | 30 | 2013 |
| Mercer County | 208 | Very hard | 177 | 20 | 2024 |
| Pulaski County | 208 | Very hard | 960 | 244 | 2023 |
| Pettis County | 207.5 | Very hard | 98 | 32 | 2017 |
| Oregon County | 207 | Very hard | 545 | 52 | 2026 |
| Pike County | 206 | Very hard | 100 | 9 | 2022 |
| Putnam County | 206 | Very hard | 293 | 27 | 2026 |
| Polk County | 204 | Very hard | 185 | 33 | 2025 |
| Douglas County | 203 | Very hard | 178 | 30 | 2025 |
| Webster County | 201 | Very hard | 102 | 23 | 2025 |
| Cape Girardeau County | 200 | Very hard | 420 | 42 | 2016 |
| Howell County | 200 | Very hard | 54 | 31 | 2025 |
| Laclede County | 200 | Very hard | 90 | 23 | 2024 |
| Lewis County | 200 | Very hard | 203 | 35 | 2025 |
| Morgan County | 200 | Very hard | 35 | 12 | 2016 |
| Osage County | 200 | Very hard | 29 | 16 | 2004 |
| Ozark County | 200 | Very hard | 367 | 22 | 2023 |
| Platte County | 199 | Very hard | 326 | 36 | 2023 |
| Adair County | 196.5 | Very hard | 48 | 13 | 2025 |
| Macon County | 196.5 | Very hard | 227 | 56 | 2026 |
| Wright County | 195 | Very hard | 26 | 15 | 2014 |
| Andrew County | 191 | Very hard | 147 | 19 | 2018 |
| Dallas County | 190.5 | Very hard | 486 | 49 | 2025 |
| Livingston County | 188 | Very hard | 599 | 30 | 2025 |
| Dade County | 187 | Very hard | 111 | 29 | 2020 |
| Bates County | 186 | Very hard | 270 | 27 | 2023 |
| Knox County | 186 | Very hard | 32 | 9 | 2024 |
| Marion County | 186 | Very hard | 247 | 18 | 2024 |
| Lawrence County | 185 | Very hard | 310 | 73 | 2025 |
| Lincoln County | 185 | Very hard | 342 | 28 | 2025 |
| Crawford County | 183 | Very hard | 633 | 50 | 2023 |
| Jasper County | 183 | Very hard | 1,781 | 184 | 2026 |
| Maries County | 183 | Very hard | 53 | 15 | 2011 |
| Sullivan County | 182 | Very hard | 413 | 30 | 2023 |
| Dent County | 180 | Very hard | 166 | 37 | 2023 |
| Stoddard County | 180 | Very hard | 168 | 62 | 2017 |
| Phelps County | 179 | Hard | 457 | 82 | 2025 |
| Cooper County | 176 | Hard | 278 | 31 | 2023 |
| Grundy County | 176 | Hard | 158 | 41 | 2023 |
| Shelby County | 175 | Hard | 18 | 5 | 2022 |
| Iron County | 174 | Hard | 272 | 67 | 2025 |
| Christian County | 172.5 | Hard | 616 | 63 | 2023 |
| Carter County | 170 | Hard | 180 | 24 | 2021 |
| Shannon County | 170 | Hard | 309 | 75 | 2023 |
| Texas County | 169.5 | Hard | 130 | 38 | 2025 |
| Ripley County | 160 | Hard | 241 | 19 | 2023 |
| Linn County | 157 | Hard | 123 | 34 | 2025 |
| Newton County | 157 | Hard | 639 | 120 | 2026 |
| Mississippi County | 156 | Hard | 96 | 31 | 2019 |
| Barton County | 153 | Hard | 309 | 65 | 2025 |
| Chariton County | 152 | Hard | 417 | 46 | 2025 |
| Barry County | 150 | Hard | 567 | 92 | 2025 |
| Scott County | 149 | Hard | 48 | 35 | 2019 |
| Cedar County | 143 | Hard | 162 | 24 | 2021 |
| Cole County | 140 | Hard | 268 | 28 | 2023 |
| Franklin County | 140 | Hard | 398 | 74 | 2023 |
| McDonald County | 140 | Hard | 1,109 | 48 | 2026 |
| Stone County | 138 | Hard | 428 | 24 | 2023 |
| Madison County | 137 | Hard | 385 | 60 | 2025 |
| Dunklin County | 136 | Hard | 251 | 43 | 2023 |
| Reynolds County | 136 | Hard | 957 | 125 | 2025 |
| New Madrid County | 130 | Hard | 233 | 56 | 2023 |
| Vernon County | 130 | Hard | 315 | 67 | 2022 |
| Butler County | 128.5 | Hard | 174 | 38 | 2023 |
| Ralls County | 120 | Hard | 200 | 5 | 2014 |
| Bollinger County | 119 | Moderately hard | 93 | 13 | 2023 |
| Taney County | 116 | Moderately hard | 716 | 40 | 2023 |
| Wayne County | 113 | Moderately hard | 236 | 16 | 2025 |
| Ste. Genevieve County | 65.5 | Moderately hard | 144 | 29 | 2025 |
| Pemiscot County | 62.3 | Moderately hard | 79 | 35 | 2018 |
| 3 additional results from sites without county attribution (not shown). | |||||
ZIP codes
ZIP codes in Missouri
The ZIP codes below are grouped by the Missouri county each mostly falls within (by land area). Each ZIP takes that county's measured median — shown in the group header — so this is a ZIP-to-county guide, not a separate reading for every ZIP. To check the water system serving a specific address, use the lookup.
Key: a † after a ZIP means it has no mapped community water system — usually a private-well area. Plain ZIPs are served by a mapped community water system.
Clay County · 514.5 mg/L · Very hard
64024640486406064068†6407264089641166411764118641196415564156641576415864161641656416664167
Henry County · 446 mg/L · Very hard
64726647356474064770647886532365360
Randolph County · 430 mg/L · Very hard
6523965243652446525765259652606527065278
Boone County · 400 mg/L · Very hard
6501065039652016520265203652156521665255652566527965284
St. Francois County · 321 mg/L · Very hard
63036†63087†63601†63624†63628†6363763640†63653
Audrain County · 290 mg/L · Very hard
633456335263382652326524065264†652656528065285
Callaway County · 290 mg/L · Very hard
63388650436505965063650676507765080652316525165262
Saline County · 280 mg/L · Very hard
65320†653216532765330653396534065344†653476534965351
Ray County · 275 mg/L · Very hard
6401764035†64036†64062640776408464085
Atchison County · 270 mg/L · Very hard
6444664482644916449664498
Howard County · 270 mg/L · Very hard
6523065248652506525465274
St. Clair County · 270 mg/L · Very hard
6472464738†6476364776†64780†64781†
Clinton County · 268.5 mg/L · Very hard
6445464465644776449064492†64493
Jackson County · 260 mg/L · Very hard
6401464015640166402964030640346405064052640536405464055640566405764058†640636406464065†64066†6407064075640816408264086640886410164102641056410664108641096411064111641126411364114641206412364124641256412664127641286412964130641316413264133641346413664137641386413964145641466414764149
Buchanan County · 255 mg/L · Very hard
644016444064443644486448464501†64503†6450464506†64507
Caldwell County · 254 mg/L · Very hard
6462464625†6463764644646496465064671
Clark County · 250 mg/L · Very hard
63430634456345363465634666347263474
St. Charles County · 250 mg/L · Very hard
63301†63303633046333263341633486336563366633676336863373†633766338563386†
Gasconade County · 240 mg/L · Very hard
63091†65014†65041†65061†65066
Washington County · 240 mg/L · Very hard
63030†63071†6362263626†63630†63631†63648†63660†63664†63674†
Lafayette County · 237 mg/L · Very hard
640016401164020640216402264037640676407164074640766409664097
St. Louis County · 231.5 mg/L · Very hard
6300563011630176302163025630316303363034630386304063042630436304463045630746308863105631146311763119631216312263123631246312563126631276312863129631306313163132631336313463135631366313763138†6314063141631436314463146
Perry County · 231 mg/L · Very hard
63732†63746†63748†637706377563783†
Holt County · 230 mg/L · Very hard
6443764451644666447064473
Daviess County · 226.5 mg/L · Very hard
6462064636646406464764648646546467064689
Camden County · 225 mg/L · Very hard
65020†6504965052†6506565079†65324†65567655916578665787†
St. Louis County · 225 mg/L · Very hard
63101631026310363104631066310763108631096311063111631126311363115631166311863120631396314763155
Benton County · 224.5 mg/L · Very hard
65325†65326†65338†65345†65355†
Cass County · 220.5 mg/L · Very hard
64012640786408064083640906470164725647346473964742647436474664747
Miller County · 220 mg/L · Very hard
65017†65026†65032†65047†65064†65075†65082†65083†65486†
Montgomery County · 219 mg/L · Very hard
63333†6335063361633636338465069
DeKalb County · 217 mg/L · Very hard
644226442964430644696447464497
Worth County · 216 mg/L · Very hard
64420644416445664486†64499
Harrison County · 215 mg/L · Very hard
6442464426644426445864467644716448164642†
Moniteau County · 215 mg/L · Very hard
6501865025†65046†65050†65074†65081†65287
Hickory County · 213.5 mg/L · Very hard
65634†65650†65668†65724†65732†65735†65774†65779†
Greene County · 213 mg/L · Very hard
65604†65612†6561965648†65738†65742†65757†65770†65781†658016580265803†65804658066580765809†6581065897
Warren County · 211.5 mg/L · Very hard
633516335763380633816338363390
Jefferson County · 211 mg/L · Very hard
6301063012630166301963020†63023†63026630286304763048†6304963050†63051630526305363070
Johnson County · 210 mg/L · Very hard
64019640406406164093647336476165305†65336†
Nodaway County · 210 mg/L · Very hard
644236442864431644326443364434644456445564457644616446864475644766447964487
Mercer County · 208 mg/L · Very hard
646326466164673
Pulaski County · 208 mg/L · Very hard
654526545765461†65473†65534†655566558365584
Pettis County · 207.5 mg/L · Very hard
65301653326533365334†65335†6533765350†
Oregon County · 207 mg/L · Very hard
65606†65690†65692†65778†65791†
Pike County · 206 mg/L · Very hard
63330†63334633366333963344633536335963433†63441
Putnam County · 206 mg/L · Very hard
6355163565635676465564672
Polk County · 204 mg/L · Very hard
65601†65613†65617†65640†65649†6566365674†65710†65725†65727†
Douglas County · 203 mg/L · Very hard
65608†65638†65702†65755†65768†
Webster County · 201 mg/L · Very hard
65652†65706†65713†65746†
Cape Girardeau County · 200 mg/L · Very hard
63701637036373963743†63744†637456374763755637666376963785†
Howell County · 200 mg/L · Very hard
655486568865775†65777†65788†65789†65790†65793
Laclede County · 200 mg/L · Very hard
6546365470†65536†6563265722
Lewis County · 200 mg/L · Very hard
6343563438634406344763448634526345763473
Morgan County · 200 mg/L · Very hard
65011†65034†65037†65072†65078†65084†65329†65354†
Osage County · 200 mg/L · Very hard
6501665024†65035†65048†6505165054†65062†65085†
Ozark County · 200 mg/L · Very hard
65609†65618†65626†65637†65655†65666†65676†65715†65729†65741†65760†65761†65762†65766†65773†65784†
Platte County · 199 mg/L · Very hard
6401864028†6407964092†64098641506415164152641536415464163641646443964444
Adair County · 196.5 mg/L · Very hard
635016353363540635446354663559
Macon County · 196.5 mg/L · Very hard
634316353063532635346353863539†63549635526355865247
Wright County · 195 mg/L · Very hard
65543†65660†656626566765704†65711†65717†
Andrew County · 191 mg/L · Very hard
6442164427644366444964459644806448364485†6449464505
Dallas County · 190.5 mg/L · Very hard
65590†65622†65644†65685†65764†65767†65783†
Livingston County · 188 mg/L · Very hard
64601646356463864656646646468664688
Dade County · 187 mg/L · Very hard
65603†65635†65646†65661†6568265752†
Bates County · 186 mg/L · Very hard
647206472264723647306474564779
Knox County · 186 mg/L · Very hard
63446634586346063531635376354763563
Marion County · 186 mg/L · Very hard
634016345463456634616346363471
Lawrence County · 185 mg/L · Very hard
64848†64873†6565465664†65705†65707†65712†65723†65756†
Lincoln County · 185 mg/L · Very hard
63343†63347†63349†633626336963377†6337963387†63389
Crawford County · 183 mg/L · Very hard
65441†65446†65449†65453†65456†65535†65565†65566†65586†
Jasper County · 183 mg/L · Very hard
6475564801648306483264833†648346483564836†6484164849†648556485764859†64862†64870†
Maries County · 183 mg/L · Very hard
6500165013†65058†65443†65459†65580†65582†
Sullivan County · 182 mg/L · Very hard
63545635566356064630†646456464664667
Dent County · 180 mg/L · Very hard
65440†65501†6554165560
Stoddard County · 180 mg/L · Very hard
63730†63735†63738†6382263825†63841638466385063936†63960†
Phelps County · 179 mg/L · Hard
65401†6540965436†6546265529†65550†65559†
Cooper County · 176 mg/L · Hard
65068†65233†65237†65276†6532265348†
Grundy County · 176 mg/L · Hard
64641646526467964683
Shelby County · 175 mg/L · Hard
63434634376343963450634516346863469
Iron County · 174 mg/L · Hard
63620†63621†63623†63636†6365063656†6366363675†65439†
Christian County · 172.5 mg/L · Hard
65610†65620†65629†65630†65631†65657†65669†6571465720†65721†65728†65753†65754†
Carter County · 170 mg/L · Hard
63937†63941†63943†63965†
Shannon County · 170 mg/L · Hard
63629†65438†65466†65479†65588†
Texas County · 169.5 mg/L · Hard
6544465464†65468†6548365484†6554265552†655556555765564†6557065571†65589†65689†
Ripley County · 160 mg/L · Hard
63935†6393963942†6395363955
Linn County · 157 mg/L · Hard
6355763566646286463164651646536465964674
Newton County · 157 mg/L · Hard
64804†64840†64842†6484464850†6485864865†64866†
Mississippi County · 156 mg/L · Hard
6382063823638346384563882
Barton County · 153 mg/L · Hard
64748647596476264769
Chariton County · 152 mg/L · Hard
646586466064676646816523665246652616528165286
Barry County · 150 mg/L · Hard
64874†65605†6562365625†65641†65647†65658†6570865734†6574565769†65772
Scott County · 149 mg/L · Hard
63736637406374263758637676377163774637806378463801†63824
Cedar County · 143 mg/L · Hard
647446475665785†
Cole County · 140 mg/L · Hard
65023†65040†65053†650766510165109
Franklin County · 140 mg/L · Hard
6301363014†6301563037†6303963041†6305563056†63060†63061†63068†6306963072†6307363077†63079†63080†63084†6308963090
McDonald County · 140 mg/L · Hard
6483164843†64847†64854648566486164863†6486764868†65730
Stone County · 138 mg/L · Hard
65611†65624†65633†65656†65675†65681†65686†65737†65747
Madison County · 137 mg/L · Hard
6364563655
Dunklin County · 136 mg/L · Hard
638216382963837638476384963852†6385563857†638636387663880†63933
Reynolds County · 136 mg/L · Hard
63625†63633†63638†63654†63665†
New Madrid County · 130 mg/L · Hard
6382863833†6384863860638626386663867†6386863869†63870638736387463878†
Vernon County · 130 mg/L · Hard
647286474164750647526476564767647716477264778647836478464790
Butler County · 128.5 mg/L · Hard
63901639326394063945†639546396163962
Ralls County · 120 mg/L · Hard
63436634596346263467
Bollinger County · 119 mg/L · Moderately hard
63662†63750†63751†63760†63764†63781†63782†63787†
Taney County · 116 mg/L · Moderately hard
65614†6561665627†65653†656726567965680†65726†6573165733†65739†6574065744†6575965771
Wayne County · 113 mg/L · Moderately hard
63763†63934†63944†63950†63951†63952†6395663957†63964†6396663967†
Ste. Genevieve County · 65.5 mg/L · Moderately hard
6362763670†63673†
Pemiscot County · 62.3 mg/L · Moderately hard
638266382763830638396384063851638536387763879
† 362 ZIP codes are not served by a mapped community water system — most are private-well areas. See well water hardness.
Source
Groundwater vs surface water
Missouri's groundwater measures harder than its surface water — 312 mg/L across 6,104 samples versus 184 across 28,671, about 1.7× harder. Wells draw from groundwater, so well owners in Missouri tend to see the harder number — 312 mg/L, very hard. Groundwater readings there run 140 to 601.6 mg/L across the middle 80% of samples. The comparison draws on 3,055 groundwater and 2,341 surface-water monitoring sites; 175 readings above 2,000 mg/L were logged but held out of the medians as outliers.
Groundwater (wells)
312 mg/L as CaCO₃ · 6,104 results at 3,055 stations.
Surface water (rivers, lakes)
184 mg/L as CaCO₃ · 28,671 results at 2,341 stations.
Groundwater measures about 1.7× harder than surface water here.
Chemistry
Water chemistry in Missouri
Beyond the hardness number, Missouri's water carries a fuller chemical signature — here is how its measured parameters compare to national benchmarks.
TDS
216 mg/L · n=7,773
216 mg/L — below the national county median of 226.
pH
7.8 pH · n=17,423
pH 7.8 — within the EPA secondary range of 6.5–8.5, on the alkaline side.
Alkalinity
160 mg/L as CaCO3 · n=19,756
160 mg/L — substantial buffering capacity, which resists pH swings.
Calcium : Magnesium
54.3 : 15 mg/L ≈ 3.62 : 1 · n=19,615
Calcium is about 69% of Missouri's hardness (54.3 mg/L Ca to 15 mg/L Mg), a little more calcium-rich than the national ~68% calcium share.
Parameter medians may include a small share of quality-control samples; the hardness lane is fully QC-filtered.
Aquifers
Major aquifers under Missouri
3 aquifer systems supply much of Missouri's measured groundwater.
- Alluvial aquifers — median 429 mg/L across 2,128 samples at 361 sites: very hard.
- Sand and gravel aquifers (glaciated regions) — median 329.5 mg/L across 316 samples at 231 sites: very hard.
- Mississippian aquifers — median 291 mg/L across 391 samples at 188 sites: very hard.
Together these systems account for 2,835 measured samples at 780 sites. Aquifer medians pool samples across a whole system and can mask local variation — see the national aquifer map for how these compare across states.
Trend
Hardness over time
Missouri's decade median moved from 270 mg/L in the 1930s to 204 in the 2020s. Over the series, the decade median peaked at 270 mg/L in the 1930s and bottomed at 180 in the 1970s. Decade medians reflect where and what agencies sampled in each era, not just changes in the water itself.
Scale
Where Missouri sits on the scale
On the USGS scale, Missouri's 196 mg/L is very hard — 11.4 grains per gallon, well above the 180 mg/L very-hard cutoff — among the hardest water measured in the US.
At 196 mg/L (11.4 gpg), water-softener owners in Missouri typically set their unit to this hardness — settings calculator.
Questions
Frequently asked questions
- Is Missouri's water hard?
- Missouri's median hardness is 196 mg/L as CaCO₃, "very hard" on the USGS scale and 1.4× the national county median of 140 mg/L. About 98% of residents in measured counties have hard-or-worse water.
- Which county in Missouri has the hardest water?
- Clay County, with a median of 514.5 mg/L as CaCO₃ across 132 measurements. Even the softest, Pemiscot County at 62.3 mg/L, is still "moderately hard" on the USGS scale.
- Is well water harder than city water in Missouri?
- Groundwater measures harder here — about 1.7× the surface water — so wells tend to run harder (groundwater 312 vs surface water 184 mg/L).
- How do I find my exact hardness in Missouri?
- Search your ZIP on the lookup tool, read your utility's Consumer Confidence Report, or test at home with a kit.
- Is Missouri's water harder than the national average?
- Yes. Missouri's median of 196 mg/L is 1.4× the national county median of 140 mg/L, and Missouri ranks #15 of the 50 states and D.C.
Compare
States with similar hardness
Two states measure closest to Missouri's 196 mg/L: Texas at 200 mg/L and New Mexico at 207 mg/L. Missouri measures harder than 72% of states. Browse the full ranking on the statistics page.
More: hardness scale · check your address · national statistics · the national map.
By Marko Visic, MPharm, BSc Physics. Source: USGS/EPA Water Quality Portal — 34,925 Missouri measurements. Data last verified . Methodology.
Cite this page: “Missouri Water Hardness by County.” Hard Water Map. Retrieved 2026-07-22, https://hardwatermap.com/water-hardness/missouri/