Nebraska Water Hardness by County
Water in Nebraska has a median hardness of 232 mg/L as CaCO₃ — "very hard" on the USGS scale — based on 23,863 measurements at 3,693 monitoring stations. Deuel County has the state's hardest measured water (660 mg/L); Garfield County the softest (56). Rank: #12 of the 50 states and D.C.
Nebraska water hardness map — what the numbers mean. Data verified 2026-07-22.
Of Nebraska's 81 measured counties, 58 very hard, 14 hard, 8 moderately hard, and 1 soft. The hardest are Deuel County (660 mg/L), Keith County (540), and Washington County (420). Garfield County is the softest at 56 mg/L (soft).
About 99% of Nebraska's roughly 1.9 million residents in counties with gate-passing hardness data live where tap water is hard or worse.
Statewide, Nebraska's median works out to 13.6 grains per gallon and ranks #12 of the 50 states and D.C. Across 23,863 measurements at 3,693 stations — 4,752 of them since 2000 — the middle 80% of readings fall between 86.4 and 378 mg/L. The public record runs from 1939 to 2023.
See where Nebraska sits nationally on the national map, or what its number means on the hardness scale.
Download the Nebraska water hardness map (PNG) — Water hardness by county in Nebraska: 81 counties mapped from USGS/EPA data, statewide median 232 mg/L (very hard); darker counties have harder water.
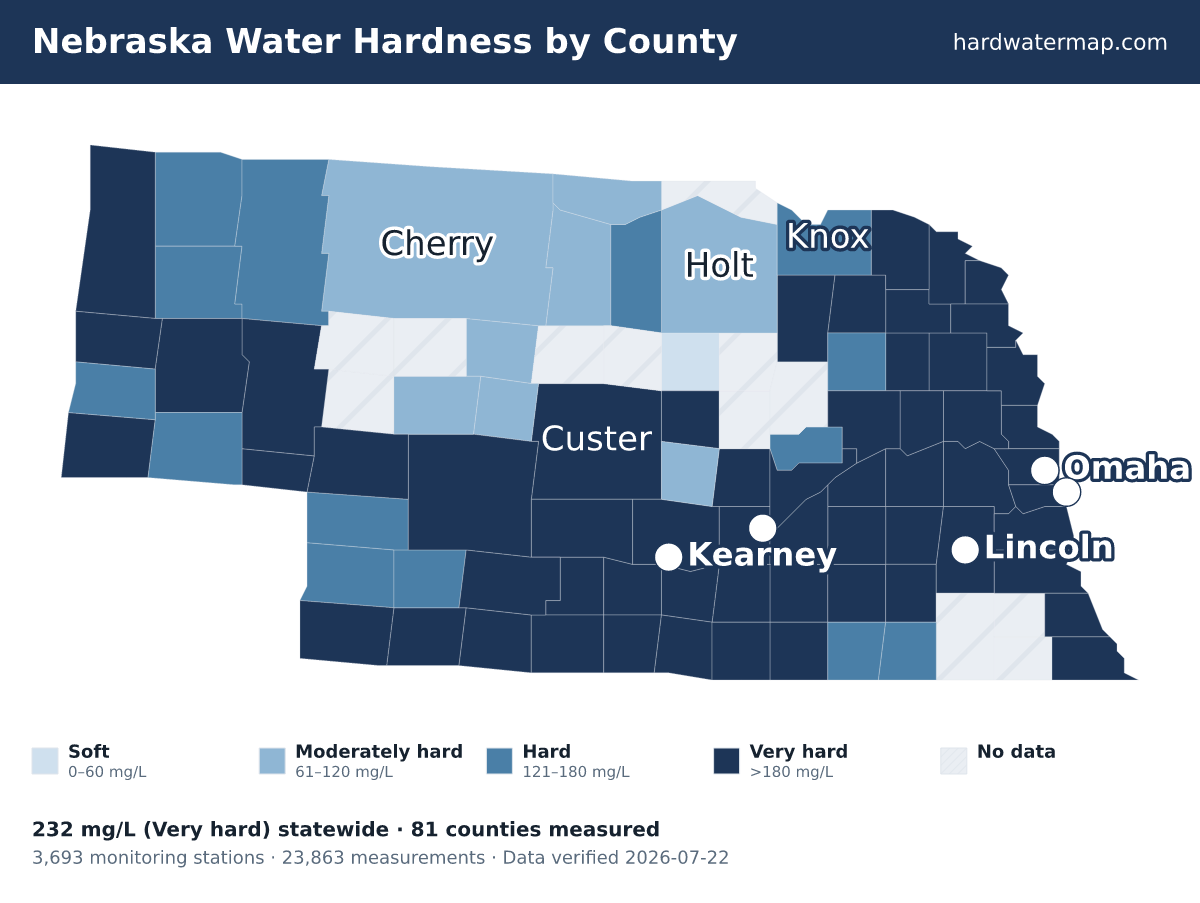
By county
Water hardness by county
The table lists all 81 measured Nebraska counties, hardest first. Their medians span 660 mg/L in Deuel County to 56 in Garfield County — a 11.8× range. 12 more Nebraska counties lack gate-passing data.
| County | Median | Band | Results | Sites | Newest |
|---|---|---|---|---|---|
| Deuel County | 660 | Very hard | 49 | 10 | 2003 |
| Keith County | 540 | Very hard | 153 | 47 | 2023 |
| Washington County | 420 | Very hard | 83 | 23 | 2015 |
| Wayne County | 420 | Very hard | 27 | 12 | 2015 |
| Burt County | 356.5 | Very hard | 178 | 39 | 2015 |
| Kearney County | 350 | Very hard | 127 | 42 | 2015 |
| Hamilton County | 340.5 | Very hard | 201 | 74 | 2015 |
| Thurston County | 330 | Very hard | 419 | 11 | 2014 |
| Stanton County | 328 | Very hard | 67 | 18 | 2015 |
| Lancaster County | 310 | Very hard | 1,694 | 216 | 2023 |
| Phelps County | 310 | Very hard | 65 | 43 | 2002 |
| Valley County | 309 | Very hard | 222 | 41 | 2002 |
| Buffalo County | 303 | Very hard | 393 | 79 | 2009 |
| Fillmore County | 300 | Very hard | 34 | 19 | 2015 |
| Saunders County | 290 | Very hard | 167 | 37 | 2023 |
| Hall County | 287.5 | Very hard | 458 | 132 | 2015 |
| Richardson County | 284.5 | Very hard | 652 | 24 | 2020 |
| Dawson County | 280 | Very hard | 558 | 50 | 2013 |
| Furnas County | 280 | Very hard | 277 | 13 | 2016 |
| Scotts Bluff County | 279 | Very hard | 1,084 | 162 | 2002 |
| Polk County | 273 | Very hard | 22 | 16 | 2015 |
| Platte County | 270 | Very hard | 375 | 20 | 2023 |
| Cuming County | 269 | Very hard | 259 | 33 | 2015 |
| Dodge County | 264.5 | Very hard | 908 | 80 | 2023 |
| Douglas County | 260 | Very hard | 1,283 | 71 | 2023 |
| Garden County | 260 | Very hard | 518 | 59 | 2011 |
| Merrick County | 260 | Very hard | 551 | 48 | 2011 |
| Dixon County | 255 | Very hard | 71 | 12 | 2020 |
| Cedar County | 254.9 | Very hard | 144 | 57 | 2020 |
| Cass County | 250 | Very hard | 281 | 29 | 2016 |
| Clay County | 250 | Very hard | 43 | 28 | 2015 |
| Dakota County | 250 | Very hard | 186 | 17 | 2016 |
| Gosper County | 250 | Very hard | 42 | 21 | 2013 |
| Harlan County | 250 | Very hard | 207 | 25 | 2002 |
| Nemaha County | 250 | Very hard | 151 | 12 | 2016 |
| Webster County | 250 | Very hard | 325 | 14 | 2015 |
| York County | 250 | Very hard | 168 | 79 | 2015 |
| Dundy County | 240 | Very hard | 530 | 75 | 2016 |
| Lincoln County | 240 | Very hard | 413 | 125 | 2023 |
| Red Willow County | 236 | Very hard | 85 | 25 | 2002 |
| Morrill County | 230 | Very hard | 154 | 118 | 2002 |
| Otoe County | 230 | Very hard | 568 | 12 | 2020 |
| Sioux County | 229 | Very hard | 752 | 86 | 2002 |
| Franklin County | 220 | Very hard | 24 | 15 | 2015 |
| Sarpy County | 218 | Very hard | 895 | 70 | 2023 |
| Antelope County | 212 | Very hard | 57 | 36 | 2013 |
| Hitchcock County | 210 | Very hard | 247 | 30 | 2002 |
| Kimball County | 210 | Very hard | 40 | 10 | 2002 |
| Pierce County | 210 | Very hard | 101 | 38 | 2015 |
| Seward County | 210 | Very hard | 789 | 32 | 2020 |
| Frontier County | 200 | Very hard | 55 | 42 | 2014 |
| Butler County | 190 | Very hard | 100 | 31 | 2015 |
| Colfax County | 190 | Very hard | 97 | 20 | 2023 |
| Custer County | 190 | Very hard | 70 | 49 | 2019 |
| Saline County | 190 | Very hard | 342 | 29 | 2015 |
| Nuckolls County | 186 | Very hard | 325 | 22 | 2015 |
| Adams County | 180 | Very hard | 75 | 27 | 2015 |
| Howard County | 180 | Very hard | 480 | 40 | 2002 |
| Hayes County | 169 | Hard | 44 | 39 | 2002 |
| Box Butte County | 166 | Hard | 22 | 19 | 2003 |
| Jefferson County | 163 | Hard | 50 | 24 | 2015 |
| Sheridan County | 160 | Hard | 71 | 32 | 2003 |
| Perkins County | 151 | Hard | 67 | 65 | 2002 |
| Dawes County | 150 | Hard | 35 | 10 | 2013 |
| Madison County | 150 | Hard | 342 | 25 | 2007 |
| Banner County | 147.5 | Hard | 78 | 68 | 2002 |
| Chase County | 140 | Hard | 91 | 82 | 2002 |
| Cheyenne County | 138.5 | Hard | 90 | 44 | 2005 |
| Nance County | 129 | Hard | 624 | 61 | 2023 |
| Rock County | 124 | Hard | 65 | 16 | 2003 |
| Thayer County | 124 | Hard | 39 | 16 | 2015 |
| Knox County | 123.5 | Hard | 312 | 24 | 2020 |
| Sherman County | 100.5 | Moderately hard | 104 | 42 | 2000 |
| Holt County | 99 | Moderately hard | 876 | 145 | 2004 |
| Keya Paha County | 95.2 | Moderately hard | 232 | 15 | 2013 |
| Cherry County | 91.8 | Moderately hard | 277 | 51 | 2013 |
| Logan County | 76.5 | Moderately hard | 16 | 14 | 2019 |
| Brown County | 74 | Moderately hard | 730 | 54 | 2003 |
| Thomas County | 71.1 | Moderately hard | 289 | 5 | 2023 |
| McPherson County | 63 | Moderately hard | 39 | 29 | 2004 |
| Garfield County | 56 | Soft | 114 | 14 | 2004 |
ZIP codes
ZIP codes in Nebraska
The ZIP codes below are grouped by the Nebraska county each mostly falls within (by land area). Each ZIP takes that county's measured median — shown in the group header — so this is a ZIP-to-county guide, not a separate reading for every ZIP. To check the water system serving a specific address, use the lookup.
Key: a † after a ZIP means it has no mapped community water system — usually a private-well area. Plain ZIPs are served by a mapped community water system.
Deuel County · 660 mg/L · Very hard
69122†69129†
Keith County · 540 mg/L · Very hard
69127†69144†69146†69153†69155†
Washington County · 420 mg/L · Very hard
68002†68008†68023†68029†68034†68068†
Wayne County · 420 mg/L · Very hard
68723†68740†68787†68790†
Burt County · 356.5 mg/L · Very hard
68019†68020†68038†68045†68061†
Kearney County · 350 mg/L · Very hard
68924†68945†68959†
Hamilton County · 340.5 mg/L · Very hard
68818†68841†68843†68846†68854†68865†
Thurston County · 330 mg/L · Very hard
68039†68047†68055†68062†68067†68071†68733
Stanton County · 328 mg/L · Very hard
68768†68779†
Lancaster County · 310 mg/L · Very hard
68317†68336†68339†68358†68368†6837268402†68404†6841968428†68430†6843868461†68462†685026850368504685056850668507†68508685106851268514†6851668517†68520†68521†68522†68523†68524†68526†68527†68528†68531†68532†68588
Phelps County · 310 mg/L · Very hard
6892368927†68940†6894968958†
Valley County · 309 mg/L · Very hard
68815†68837†68859†68862
Buffalo County · 303 mg/L · Very hard
68812†68836†68840†68845†68847†6884968858†68861†68866†68869†68870†68876†
Fillmore County · 300 mg/L · Very hard
68351†6835468361†68365†68406†68416†68436†68444†
Saunders County · 290 mg/L · Very hard
68003†68015†68017†68018†68033†68040†68041†68042†68050†68065†68066†68070†68073†68648†
Hall County · 287.5 mg/L · Very hard
68801†68803†68810†68824†68832†68883†
Richardson County · 284.5 mg/L · Very hard
68337†68355†6837668431†68433†68437†68442†68457†
Dawson County · 280 mg/L · Very hard
68834†68850†68863†68878†69130†69138†69171†
Furnas County · 280 mg/L · Very hard
68922†68926†68936†68946†68948†6896769046†
Scotts Bluff County · 279 mg/L · Very hard
69341†69352†69353†69355†69356†
Polk County · 273 mg/L · Very hard
68367†68651†68654†68662†68666†
Platte County · 270 mg/L · Very hard
68601†68631†68634†68642†68643†68644†68647†68653†
Cuming County · 269 mg/L · Very hard
68004†68716†68788†68791†
Dodge County · 264.5 mg/L · Very hard
6802568031†68044†68057†68063†68072†68621†68633†68649†68664
Douglas County · 260 mg/L · Very hard
6800768010†6802268064†68069†681026810468105681066810768108681106811168112†6811468116681176811868122†681246812768130681316813268134681356813768142†68144681526815468164681786818268183
Garden County · 260 mg/L · Very hard
69147†69148†69154†
Merrick County · 260 mg/L · Very hard
68628†68663†68816†68826†68827†68864†
Dixon County · 255 mg/L · Very hard
68710†68728†68732†6875168757†68770†68784†68785†
Cedar County · 254.9 mg/L · Very hard
68717†68727†68736†68739†68745†68749†68771†68774†68792†
Cass County · 250 mg/L · Very hard
680166803768048†68058†68304†68307†68347†68349†68366†6840368407†68409†68413†68455†68463†
Clay County · 250 mg/L · Very hard
68452†68933†68935†68938†68941†68944†68954†68975†6897968980†
Dakota County · 250 mg/L · Very hard
68030†68731†68741†68743†68776†
Gosper County · 250 mg/L · Very hard
68937†68976†
Harlan County · 250 mg/L · Very hard
68920†68966†68971†68977†
Nemaha County · 250 mg/L · Very hard
68305†68320†68321†68378†68414†68421†
Webster County · 250 mg/L · Very hard
68928†68930†68942†68952†68970†
York County · 250 mg/L · Very hard
68316†68319†68371†68401†68460†68467
Dundy County · 240 mg/L · Very hard
69021†69030†69037†69041†
Lincoln County · 240 mg/L · Very hard
69039†69101†69123†69132†69143†69151†69165†69169†69170†
Red Willow County · 236 mg/L · Very hard
69001†69020†69026†69034†69036†
Morrill County · 230 mg/L · Very hard
69125†69331†69334†69336†
Otoe County · 230 mg/L · Very hard
68324†68344†68346†68379†68382†68410†68417†68418†68446†68448†68454†
Sioux County · 229 mg/L · Very hard
69346†69354†69357†69358†69361†
Franklin County · 220 mg/L · Very hard
68929†68932†68939†68947†68960†68972†68981†68982†
Sarpy County · 218 mg/L · Very hard
6800568028†68046†6805668059†68113681236812868133†68136681386814768157†
Antelope County · 212 mg/L · Very hard
68636†68720†68726†68756†68761†68764†68773†68781†
Hitchcock County · 210 mg/L · Very hard
69024†69043†69044†
Kimball County · 210 mg/L · Very hard
69128†69133†69145†
Pierce County · 210 mg/L · Very hard
68747†68765†6876768769†
Seward County · 210 mg/L · Very hard
68313†68314†68330†68360†68364†68405†68423†68434†68439†68456†
Frontier County · 200 mg/L · Very hard
69022†69025†69028†69029†69038†69042†
Butler County · 190 mg/L · Very hard
68001†68014†68036†68624†68626†68632†686356865868667†68669†
Colfax County · 190 mg/L · Very hard
68629†68641†68659†68661†
Custer County · 190 mg/L · Very hard
68813†68814†68822†68825†68828†68855†68856†68860†68874†68881†69120†
Saline County · 190 mg/L · Very hard
6833368343†68359†68445†68453†68464†68465†
Nuckolls County · 186 mg/L · Very hard
68934†68943†68957†68961†68964†68974†68978†
Adams County · 180 mg/L · Very hard
6890168925†68950†68955†68956†68973†
Howard County · 180 mg/L · Very hard
68820†68831†68835†68838†68872†68873†
Hayes County · 169 mg/L · Hard
69032†69040†
Box Butte County · 166 mg/L · Hard
69301†69348†
Jefferson County · 163 mg/L · Hard
68338†68342†68350†68352†68377†68424†68429†68440†
Sheridan County · 160 mg/L · Hard
69335†69340†69347†69351†69360†69365†
Perkins County · 151 mg/L · Hard
69134†69140†69150†69168†
Dawes County · 150 mg/L · Hard
6933769339†69367†
Madison County · 150 mg/L · Hard
6870168715†68748†68752†68758†
Banner County · 147.5 mg/L · Hard
69345†
Chase County · 140 mg/L · Hard
69023†69027†69033†69045†
Cheyenne County · 138.5 mg/L · Hard
69131†69141†69149†69156†69162†
Nance County · 129 mg/L · Hard
68623†68638†68640†
Rock County · 124 mg/L · Hard
68714†68759†
Thayer County · 124 mg/L · Hard
68303†68315†68322†68325†68326†6832768335†68340†68362†68370†68375†
Knox County · 123.5 mg/L · Hard
68718†68724†68729†68730†68760†68783†68786†68789†
Sherman County · 100.5 mg/L · Moderately hard
68817†68844†68852†68853†68871†
Holt County · 99 mg/L · Moderately hard
68711†68713†68725†68734†68735†68742†68763†68766†68780†
Keya Paha County · 95.2 mg/L · Moderately hard
68753†68778†69220†
Cherry County · 91.8 mg/L · Moderately hard
69135†69161†69201†69211†69212†69216†69218†69219†69221†69343†69366†
Logan County · 76.5 mg/L · Moderately hard
69163†
Brown County · 74 mg/L · Moderately hard
69210†69214†69217†
Thomas County · 71.1 mg/L · Moderately hard
69142†69166†
McPherson County · 63 mg/L · Moderately hard
69167†
Garfield County · 56 mg/L · Soft
68823†
† 464 ZIP codes are not served by a mapped community water system — most are private-well areas. See well water hardness.
Source
Groundwater vs surface water
Nebraska's groundwater measures harder than its surface water — 250 mg/L across 6,922 samples versus 230 across 16,904, about 1.1× harder. Wells draw from groundwater, so well owners in Nebraska tend to see the harder number — 250 mg/L, very hard. Groundwater readings there run 106 to 452 mg/L across the middle 80% of samples. The comparison draws on 3,071 groundwater and 608 surface-water monitoring sites; 6 readings above 2,000 mg/L were logged but held out of the medians as outliers.
Groundwater (wells)
250 mg/L as CaCO₃ · 6,922 results at 3,071 stations.
Surface water (rivers, lakes)
230 mg/L as CaCO₃ · 16,904 results at 608 stations.
Groundwater measures about 1.1× harder than surface water here.
Chemistry
Water chemistry in Nebraska
Beyond the hardness number, Nebraska's water carries a fuller chemical signature — here is how its measured parameters compare to national benchmarks.
TDS
482 mg/L · n=4,442
482 mg/L — about 2.1× the national county median of 226, consistent with hard, mineral-rich water.
pH
8.2 pH · n=8,079
pH 8.2 — within the EPA secondary range of 6.5–8.5, on the alkaline side.
Alkalinity
184 mg/L as CaCO3 · n=9,796
184 mg/L — substantial buffering capacity, which resists pH swings.
Calcium : Magnesium
70.1 : 22 mg/L ≈ 3.19 : 1 · n=5,907
Calcium is about 66% of Nebraska's hardness (70.1 mg/L Ca to 22 mg/L Mg), a little more magnesium-rich than the national ~68% calcium share.
Parameter medians may include a small share of quality-control samples; the hardness lane is fully QC-filtered.
Aquifers
Major aquifers under Nebraska
3 aquifer systems supply much of Nebraska's measured groundwater.
- Lower Cretaceous aquifers — median 391 mg/L across 268 samples at 145 sites: very hard.
- Sand and gravel aquifers (glaciated regions) — median 298 mg/L across 318 samples at 56 sites: very hard.
- Alluvial aquifers — median 270 mg/L across 2,409 samples at 1,008 sites: very hard.
Together these systems account for 2,995 measured samples at 1,209 sites. Aquifer medians pool samples across a whole system and can mask local variation — see the national aquifer map for how these compare across states.
Trend
Hardness over time
Nebraska's decade median moved from 200 mg/L in the 1940s to 267.8 in the 2020s. Over the series, the decade median peaked at 282 mg/L in the 2010s and bottomed at 200 in the 1940s. Decade medians reflect where and what agencies sampled in each era, not just changes in the water itself.
Scale
Where Nebraska sits on the scale
On the USGS scale, Nebraska's 232 mg/L is very hard — 13.6 grains per gallon, well above the 180 mg/L very-hard cutoff — among the hardest water measured in the US.
At 232 mg/L (13.6 gpg), water-softener owners in Nebraska typically set their unit to this hardness — settings calculator.
Questions
Frequently asked questions
- Is Nebraska's water hard?
- Nebraska's median hardness is 232 mg/L as CaCO₃, "very hard" on the USGS scale and 1.66× the national county median of 140 mg/L. About 99% of residents in measured counties have hard-or-worse water.
- Which county in Nebraska has the hardest water?
- Deuel County, with a median of 660 mg/L as CaCO₃ across 49 measurements.
- Is well water harder than city water in Nebraska?
- Groundwater measures harder here — about 1.1× the surface water — so wells tend to run harder (groundwater 250 vs surface water 230 mg/L).
- How do I find my exact hardness in Nebraska?
- Search your ZIP on the lookup tool, read your utility's Consumer Confidence Report, or test at home with a kit.
- Is Nebraska's water harder than the national average?
- Yes. Nebraska's median of 232 mg/L is 1.66× the national county median of 140 mg/L, and Nebraska ranks #12 of the 50 states and D.C.
Compare
States with similar hardness
Two states measure closest to Nebraska's 232 mg/L: Wyoming at 243.5 mg/L and New Mexico at 207 mg/L. Nebraska measures harder than 78% of states. Browse the full ranking on the statistics page.
More: hardness scale · check your address · national statistics · the national map.
By Marko Visic, MPharm, BSc Physics. Source: USGS/EPA Water Quality Portal — 23,863 Nebraska measurements. Data last verified . Methodology.
Cite this page: “Nebraska Water Hardness by County.” Hard Water Map. Retrieved 2026-07-22, https://hardwatermap.com/water-hardness/nebraska/