North Carolina Water Hardness by County
Water in North Carolina has a median hardness of 27 mg/L as CaCO₃ — "soft" on the USGS scale — based on 79,363 measurements at 6,311 monitoring stations. Pamlico County has the state's hardest measured water (470 mg/L); Transylvania County the softest (5). Rank: #44 of the 50 states and D.C.
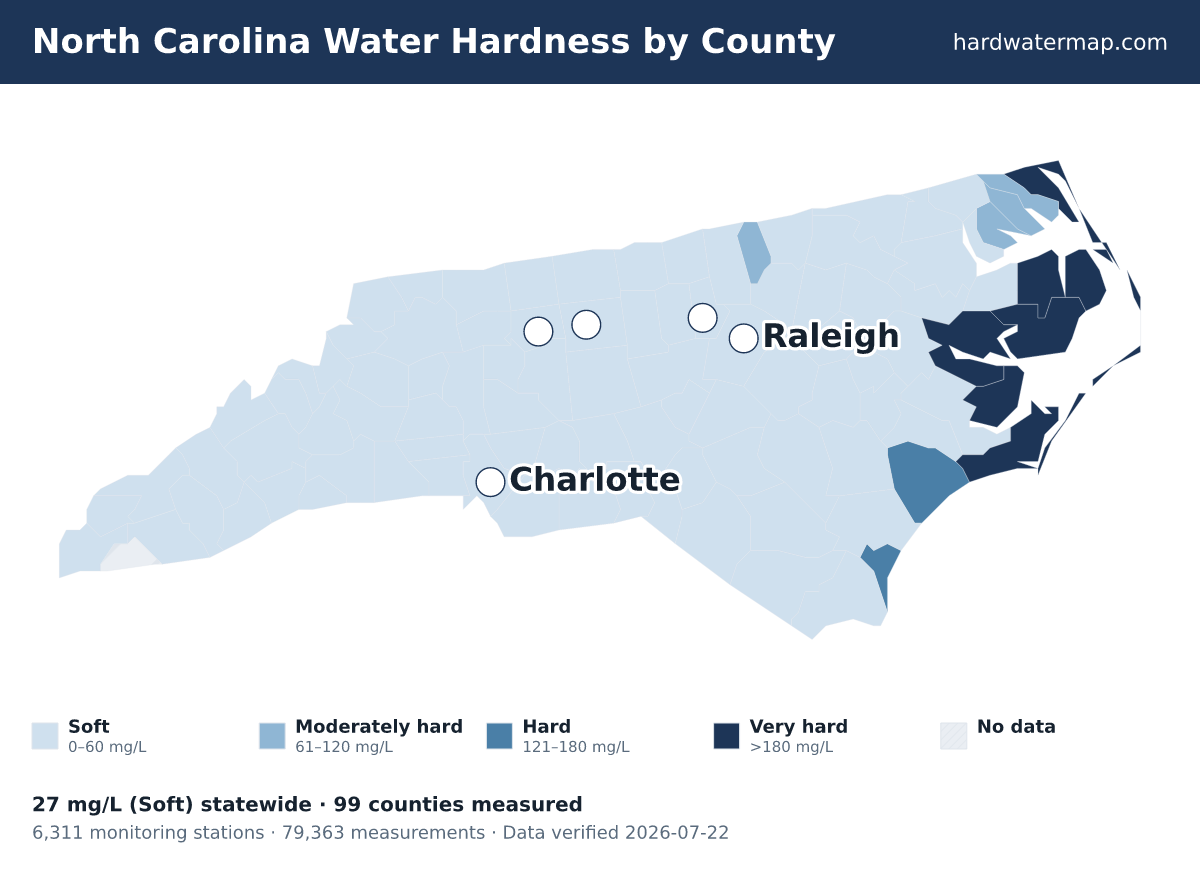
North Carolina water hardness map — what the numbers mean. Data verified 2026-07-22.
Of North Carolina's 99 measured counties, 7 very hard, 2 hard, 4 moderately hard, and 86 soft. The hardest are Pamlico County (470 mg/L), Beaufort County (310), and Hyde County (305). Transylvania County is the softest at 5 mg/L (soft).
About 6% of North Carolina's roughly 10.6 million residents in counties with gate-passing hardness data live where tap water is hard or worse.
Statewide, North Carolina's median works out to 1.6 grains per gallon and ranks #44 of the 50 states and D.C. Across 79,363 measurements at 6,311 stations — 14,418 of them since 2000 — the middle 80% of readings fall between 9 and 94 mg/L. The public record runs from 1909 to 2026.
See where North Carolina sits nationally on the national map, or what its number means on the hardness scale.
Download the North Carolina water hardness map (PNG) — Water hardness by county in North Carolina: 99 counties mapped from USGS/EPA data, statewide median 27 mg/L (soft); darker counties have harder water.
By county
Water hardness by county
The table lists all 99 measured North Carolina counties, hardest first. Their medians span 470 mg/L in Pamlico County to 5 in Transylvania County — a 94× range. 1 more North Carolina county lacks gate-passing data.
| County | Median | Band | Results | Sites | Newest |
|---|---|---|---|---|---|
| Pamlico County | 470 | Very hard | 328 | 68 | 2022 |
| Beaufort County | 310 | Very hard | 2,720 | 288 | 2025 |
| Hyde County | 305 | Very hard | 190 | 92 | 2013 |
| Currituck County | 240 | Very hard | 71 | 48 | 2014 |
| Carteret County | 231 | Very hard | 1,434 | 78 | 2025 |
| Tyrrell County | 190 | Very hard | 614 | 92 | 2025 |
| Dare County | 180 | Very hard | 164 | 67 | 2012 |
| New Hanover County | 170 | Hard | 1,031 | 221 | 2025 |
| Onslow County | 126.5 | Hard | 1,181 | 91 | 2025 |
| Vance County | 100 | Moderately hard | 167 | 20 | 2025 |
| Perquimans County | 96 | Moderately hard | 273 | 38 | 2014 |
| Camden County | 88 | Moderately hard | 141 | 46 | 2017 |
| Pasquotank County | 78 | Moderately hard | 351 | 73 | 2025 |
| Martin County | 58 | Soft | 645 | 411 | 2022 |
| Chowan County | 55 | Soft | 600 | 276 | 2025 |
| Mecklenburg County | 55 | Soft | 2,782 | 187 | 2025 |
| Cabarrus County | 53 | Soft | 536 | 19 | 2025 |
| Jones County | 53 | Soft | 736 | 27 | 2025 |
| Guilford County | 49 | Soft | 1,537 | 121 | 2025 |
| Randolph County | 48 | Soft | 780 | 45 | 2025 |
| Union County | 45 | Soft | 482 | 26 | 2025 |
| Davidson County | 43 | Soft | 1,287 | 39 | 2025 |
| Alamance County | 42 | Soft | 1,238 | 39 | 2025 |
| Forsyth County | 37 | Soft | 403 | 17 | 2025 |
| Duplin County | 36.5 | Soft | 577 | 75 | 2025 |
| Craven County | 36 | Soft | 2,806 | 343 | 2025 |
| Granville County | 36 | Soft | 690 | 53 | 2024 |
| Stanly County | 36 | Soft | 1,340 | 25 | 2025 |
| Rowan County | 35 | Soft | 874 | 32 | 2025 |
| Person County | 34.6 | Soft | 594 | 42 | 2024 |
| Washington County | 34 | Soft | 538 | 81 | 2024 |
| Pitt County | 33 | Soft | 2,006 | 159 | 2025 |
| Chatham County | 32.2 | Soft | 2,747 | 75 | 2025 |
| Brunswick County | 32 | Soft | 2,150 | 176 | 2025 |
| Durham County | 31 | Soft | 2,717 | 102 | 2025 |
| Lee County | 31 | Soft | 434 | 55 | 2025 |
| Caswell County | 30.5 | Soft | 338 | 19 | 2024 |
| Bertie County | 30 | Soft | 948 | 49 | 2025 |
| Northampton County | 30 | Soft | 733 | 31 | 2025 |
| Pender County | 30 | Soft | 995 | 67 | 2025 |
| Halifax County | 29 | Soft | 300 | 40 | 2013 |
| Wake County | 29 | Soft | 2,232 | 136 | 2025 |
| Warren County | 29 | Soft | 202 | 43 | 2025 |
| Greene County | 28.8 | Soft | 1,358 | 140 | 2025 |
| Orange County | 28.7 | Soft | 1,608 | 100 | 2023 |
| Gates County | 28 | Soft | 257 | 29 | 2025 |
| Johnston County | 28 | Soft | 1,063 | 108 | 2024 |
| Anson County | 27.7 | Soft | 428 | 46 | 2025 |
| Sampson County | 26 | Soft | 652 | 107 | 2025 |
| Franklin County | 25.8 | Soft | 477 | 45 | 2025 |
| Edgecombe County | 25 | Soft | 1,056 | 67 | 2025 |
| Harnett County | 25 | Soft | 609 | 34 | 2025 |
| Lenoir County | 25 | Soft | 882 | 56 | 2025 |
| Gaston County | 24 | Soft | 1,059 | 46 | 2025 |
| Hertford County | 24 | Soft | 769 | 56 | 2025 |
| Lincoln County | 23 | Soft | 449 | 58 | 2025 |
| Rockingham County | 23 | Soft | 1,210 | 59 | 2025 |
| Surry County | 23 | Soft | 274 | 13 | 2025 |
| Nash County | 22 | Soft | 280 | 35 | 2025 |
| Wilson County | 22 | Soft | 322 | 45 | 2022 |
| Columbus County | 21 | Soft | 731 | 61 | 2025 |
| Wayne County | 21 | Soft | 972 | 124 | 2022 |
| Bladen County | 20 | Soft | 1,343 | 73 | 2025 |
| Montgomery County | 20 | Soft | 550 | 38 | 2025 |
| Watauga County | 20 | Soft | 571 | 26 | 2025 |
| Ashe County | 19 | Soft | 498 | 19 | 2025 |
| Richmond County | 19 | Soft | 793 | 48 | 2025 |
| Iredell County | 18 | Soft | 526 | 44 | 2025 |
| Stokes County | 17.8 | Soft | 334 | 15 | 2025 |
| Alleghany County | 16 | Soft | 333 | 15 | 2025 |
| Cumberland County | 16 | Soft | 513 | 36 | 2025 |
| Davie County | 16 | Soft | 405 | 8 | 2010 |
| Madison County | 16 | Soft | 651 | 20 | 2025 |
| Mitchell County | 16 | Soft | 338 | 13 | 2025 |
| Moore County | 16 | Soft | 790 | 50 | 2025 |
| Rutherford County | 15 | Soft | 566 | 20 | 2025 |
| Cleveland County | 14 | Soft | 862 | 29 | 2025 |
| Yadkin County | 14 | Soft | 109 | 4 | 2014 |
| Buncombe County | 13 | Soft | 1,290 | 63 | 2025 |
| Catawba County | 13 | Soft | 784 | 34 | 2025 |
| Robeson County | 13 | Soft | 1,181 | 84 | 2026 |
| Alexander County | 12 | Soft | 203 | 9 | 2025 |
| Burke County | 12 | Soft | 1,038 | 41 | 2025 |
| McDowell County | 12 | Soft | 554 | 21 | 2025 |
| Wilkes County | 12 | Soft | 608 | 22 | 2025 |
| Polk County | 11.5 | Soft | 73 | 9 | 2014 |
| Caldwell County | 11 | Soft | 373 | 10 | 2025 |
| Cherokee County | 10 | Soft | 373 | 19 | 2025 |
| Graham County | 9 | Soft | 172 | 18 | 2024 |
| Avery County | 8 | Soft | 380 | 9 | 2025 |
| Haywood County | 8 | Soft | 1,632 | 46 | 2025 |
| Henderson County | 8 | Soft | 497 | 27 | 2025 |
| Hoke County | 7 | Soft | 333 | 19 | 2025 |
| Macon County | 7 | Soft | 729 | 30 | 2025 |
| Jackson County | 6 | Soft | 192 | 16 | 2024 |
| Scotland County | 6 | Soft | 487 | 33 | 2025 |
| Swain County | 6 | Soft | 553 | 29 | 2024 |
| Yancey County | 6 | Soft | 473 | 25 | 2025 |
| Transylvania County | 5 | Soft | 865 | 23 | 2025 |
ZIP codes
ZIP codes in North Carolina
The ZIP codes below are grouped by the North Carolina county each mostly falls within (by land area). Each ZIP takes that county's measured median — shown in the group header — so this is a ZIP-to-county guide, not a separate reading for every ZIP. To check the water system serving a specific address, use the lookup.
Key: a † after a ZIP means it has no mapped community water system — usually a private-well area. Plain ZIPs are served by a mapped community water system.
Pamlico County · 470 mg/L · Very hard
285092851028515285292853728552285562857128587
Beaufort County · 310 mg/L · Very hard
2780627808278142781727821278602786527889
Hyde County · 305 mg/L · Very hard
2781027824†27826278752788527960†
Currituck County · 240 mg/L · Very hard
279162791727923†27927†2792927939279412794727950†279562795827964279652796627973
Carteret County · 231 mg/L · Very hard
28511†2851228516†28520†28524†28528†2853128553†28557†28570†2857528577†28579†28581†2858428589†28594
Tyrrell County · 190 mg/L · Very hard
27925†
Dare County · 180 mg/L · Very hard
27915†27920279362794327948†27949279532795427959†27968†27972279782798127982
New Hanover County · 170 mg/L · Hard
28401284032840528409284112841228428†2842928449†28480
Onslow County · 126.5 mg/L · Hard
284452845428460285392854028542†28543285442854628547†285552857428582
Vance County · 100 mg/L · Moderately hard
2753627537†27544†27556†27584†
Perquimans County · 96 mg/L · Moderately hard
279192794427985
Camden County · 88 mg/L · Moderately hard
279212797427976†
Pasquotank County · 78 mg/L · Moderately hard
27909
Martin County · 58 mg/L · Soft
2782527840278412784627857278612787127892
Chowan County · 55 mg/L · Soft
2793227980
Mecklenburg County · 55 mg/L · Soft
2803128036†2807828105281342820228203282042820528206282072820828209282102821128212282132821428215282162821728223282262822728244282622826928270282732827428277282782828028282
Cabarrus County · 53 mg/L · Soft
28025280272807528081†2808328107†28124†
Jones County · 53 mg/L · Soft
2857328585
Guilford County · 49 mg/L · Soft
27214†27235†27249†272602726227265272682728227283†273012731027313†27342†27358†27377†2740127403274052740627407274082740927410274112741227455†
Randolph County · 48 mg/L · Soft
2720327205†27233†27248†2726327298†27316†27317†27341†27350†27355†27370†
Union County · 45 mg/L · Soft
2807928103†281042810828110281122817328174
Davidson County · 43 mg/L · Soft
2710727239272922729527299273512736027374
Alamance County · 42 mg/L · Soft
2720127202†2721527217†27244†27253†27258273022734027349†
Forsyth County · 37 mg/L · Soft
270092701227023†27040†270452705027051†271012710327104271052710627109271102712727284
Duplin County · 36.5 mg/L · Soft
283252834928365283982845328458284642846628508285182852128572
Craven County · 36 mg/L · Soft
285192852328526285272853228533285602856228586
Granville County · 36 mg/L · Soft
27507†2750927522†27565†27581†27582
Stanly County · 36 mg/L · Soft
2800128009†28097†281092812728128†281292813728163†
Rowan County · 35 mg/L · Soft
27013†27054†28023†280392804128071†280722808828125†28138†28144†28146†28147†28159
Person County · 34.6 mg/L · Soft
27343†27541†27572†2757327574†27583†
Washington County · 34 mg/L · Soft
279282796227970
Pitt County · 33 mg/L · Soft
278122782727828278292783427837278582787927884285132853028590
Chatham County · 32.2 mg/L · Soft
27207†2720827213†27252†27256†27312†273442751727523†27559†27562†
Brunswick County · 32 mg/L · Soft
28420†28422†28451†28452†28461284622846528467†28468†2846928470†28479†
Durham County · 31 mg/L · Soft
27503†27701277032770427705†2770727708277092771227713†
Lee County · 31 mg/L · Soft
2733027332†28355†
Caswell County · 30.5 mg/L · Soft
27212†27291†27305†27311†27314†27315†27379†
Bertie County · 30 mg/L · Soft
27805278472784927872†27924279572796727983
Northampton County · 30 mg/L · Soft
278202783127832278422784527853278622786627869278762787727897
Pender County · 30 mg/L · Soft
28421†2842528435†28443†2845728478†
Halifax County · 29 mg/L · Soft
27823278392784427850278702787427890
Wake County · 29 mg/L · Soft
2750227511275132751827519†27529†27539†27540†2754527560†2757127587†27591†27592†27597†2760127603†276042760527606†27607276082760927610†27612276132761427615†27616†27617†2769527697
Warren County · 29 mg/L · Soft
275512755327563275702758927594
Greene County · 28.8 mg/L · Soft
27888285382855428580
Orange County · 28.7 mg/L · Soft
27231†27243†27278†275102751427516†27599
Gates County · 28 mg/L · Soft
27926279352793727938279462796927979
Johnston County · 28 mg/L · Soft
275042752027524†2752727542†275552756827569†2757627577†27593
Anson County · 27.7 mg/L · Soft
280072809128102†28119281332813528170
Sampson County · 26 mg/L · Soft
28318†2832828334†28341†28344†28366†28382†28385†28393†28441†28444†
Franklin County · 25.8 mg/L · Soft
2750827525†27549†2759627816†
Edgecombe County · 25 mg/L · Soft
278012780927815278192784327852278642788127886
Harnett County · 25 mg/L · Soft
2750127505275062752127526275462832328326283392836828390
Lenoir County · 25 mg/L · Soft
28501285042852528551
Gaston County · 24 mg/L · Soft
28006†28012†28016†28021†28032†28034†28052†280542805628077280982810128120†28164†
Hertford County · 24 mg/L · Soft
2781827855279102792227942†27986
Lincoln County · 23 mg/L · Soft
2803328037†28080†2809228168†
Rockingham County · 23 mg/L · Soft
27025†27027†27048†272882732027326†27357†
Surry County · 23 mg/L · Soft
27007†27017†27024†27030†27041†27047†28621†28676†28683†
Nash County · 22 mg/L · Soft
27557†27803†2780427807†27856†278782788227891†
Wilson County · 22 mg/L · Soft
2781327822†27851†2787327880†27883†2789327896†
Columbus County · 21 mg/L · Soft
28423†28424†28430†28431†2843228436†28438†28439†28442†28450†28455†28456†2846328472†
Wayne County · 21 mg/L · Soft
2753027531275332753427830278632833328578
Bladen County · 20 mg/L · Soft
283202833228337†2839228399284332843428447†28448†
Montgomery County · 20 mg/L · Soft
27209†27229†27247†27306†27356†27371†
Watauga County · 20 mg/L · Soft
28604†28605†2860728618†28679†28692†28698†
Ashe County · 19 mg/L · Soft
28615†28617†28626†28629†28631†28640†28643†28672†28684†28693†28694†
Richmond County · 19 mg/L · Soft
28330283382834528347†2836728379
Iredell County · 18 mg/L · Soft
28115†28117†28166†28625†28634†28660†28677†28678†28689†
Stokes County · 17.8 mg/L · Soft
27016†270192702127022†27042†27043†27046†2705227053†
Alleghany County · 16 mg/L · Soft
28623†28627†28644†28663†28668†28675
Cumberland County · 16 mg/L · Soft
28301283032830428305283062830728308†28310†2831128312†28314283312834228348†28356†28391†28395†
Davie County · 16 mg/L · Soft
270062701427028†
Madison County · 16 mg/L · Soft
28743†28753†28754
Mitchell County · 16 mg/L · Soft
28705†28777
Moore County · 16 mg/L · Soft
27242†27259†27281†27325†27376†28315†283272835028373†283742838728394
Rutherford County · 15 mg/L · Soft
28018†280192802428040†28043280742807628139†2816028167†28720†28746†
Cleveland County · 14 mg/L · Soft
280172802028042†280732808628089280902811428136281502815228169
Yadkin County · 14 mg/L · Soft
27011†27018†27020†27055†28642†
Buncombe County · 13 mg/L · Soft
28701†2870428709†28711†2871528730†28748†28757287702877828787†2880128803288042880528806
Catawba County · 13 mg/L · Soft
286012860228609†28610†2861328650†286582867328682†
Robeson County · 13 mg/L · Soft
283402835728358283592836028362283642836928371283722837528378283832838428386
Alexander County · 12 mg/L · Soft
28636†28681†
Burke County · 12 mg/L · Soft
28612†28619286282863728641†28655286662867128690
McDowell County · 12 mg/L · Soft
28749†2875228761†28762
Wilkes County · 12 mg/L · Soft
28606†28624†28635†28649†28651†28654†28659†28665†2866928670†28685†28697
Polk County · 11.5 mg/L · Soft
28722†28756†28773†28782†
Caldwell County · 11 mg/L · Soft
28611†28630286382864528667
Cherokee County · 10 mg/L · Soft
28901†28905†28906†
Graham County · 9 mg/L · Soft
28702†28733†28771†
Avery County · 8 mg/L · Soft
2861628622†28646†28652†28653†28657†28662†28664†
Haywood County · 8 mg/L · Soft
28716†28721†28745†28751†28785†28786
Henderson County · 8 mg/L · Soft
28710†287262872928731†2873228735†28739†28742†287582875928790†2879128792†
Hoke County · 7 mg/L · Soft
28376†28377
Macon County · 7 mg/L · Soft
28734†2874128763†28775†28781†
Jackson County · 6 mg/L · Soft
28707†28717†28723†28725†2873628779†28783†28788†28789†
Scotland County · 6 mg/L · Soft
2834328351283522836328396
Swain County · 6 mg/L · Soft
28713†28719†
Yancey County · 6 mg/L · Soft
28714†28740†28755†
Transylvania County · 5 mg/L · Soft
28708†28712†28718†28747†28766†28768†28772†28774†
† 363 ZIP codes are not served by a mapped community water system — most are private-well areas. See well water hardness.
Source
Groundwater vs surface water
North Carolina's groundwater measures harder than its surface water — 80 mg/L across 5,597 samples versus 26 across 73,528, about 3.1× harder. Wells draw from groundwater, so well owners in North Carolina tend to see the harder number — 80 mg/L, moderately hard. Groundwater readings there run 12 to 270 mg/L across the middle 80% of samples. The comparison draws on 3,452 groundwater and 2,836 surface-water monitoring sites; 3,771 readings above 2,000 mg/L were logged but held out of the medians as outliers.
Groundwater (wells)
80 mg/L as CaCO₃ · 5,597 results at 3,452 stations.
Surface water (rivers, lakes)
26 mg/L as CaCO₃ · 73,528 results at 2,836 stations.
Groundwater measures about 3.1× harder than surface water here.
Chemistry
Water chemistry in North Carolina
Beyond the hardness number, North Carolina's water carries a fuller chemical signature — here is how its measured parameters compare to national benchmarks.
TDS
73 mg/L · n=4,835
73 mg/L — below the national county median of 226.
pH
7.1 pH · n=44,570
pH 7.1 — within the EPA secondary range of 6.5–8.5, on the alkaline side.
Alkalinity
23.9 mg/L as CaCO3 · n=8,541
23.9 mg/L — modest buffering capacity.
Calcium : Magnesium
7.4 : 2.6 mg/L ≈ 2.85 : 1 · n=10,651
Calcium is about 63% of North Carolina's hardness (7.4 mg/L Ca to 2.6 mg/L Mg), a little more magnesium-rich than the national ~68% calcium share.
Parameter medians may include a small share of quality-control samples; the hardness lane is fully QC-filtered.
Aquifers
Major aquifers under North Carolina
3 aquifer systems supply much of North Carolina's measured groundwater.
- Castle Hayne aquifer — median 210 mg/L across 838 samples at 632 sites: very hard.
- Early Mesozoic basin aquifers — median 95.8 mg/L across 79 samples at 77 sites: moderately hard.
- Northern Atlantic Coastal Plain aquifer system — median 84.5 mg/L across 1,763 samples at 1,199 sites: moderately hard.
Together these systems account for 2,680 measured samples at 1,908 sites. Aquifer medians pool samples across a whole system and can mask local variation — see the national aquifer map for how these compare across states.
Trend
Hardness over time
North Carolina's decade median moved from 160 mg/L in the 1930s to 30 in the 2020s. Over the series, the decade median peaked at 160 mg/L in the 1930s and bottomed at 15 in the 1970s. Decade medians reflect where and what agencies sampled in each era, not just changes in the water itself.
Scale
Where North Carolina sits on the scale
On the USGS scale, North Carolina's 27 mg/L is soft — 1.6 grains per gallon, below the 60 mg/L soft cutoff — among the softest water measured in the US.
Questions
Frequently asked questions
- Is North Carolina's water hard?
- North Carolina's median hardness is 27 mg/L as CaCO₃, "soft" on the USGS scale and below the national county median of 140 mg/L.
- Which county in North Carolina has the hardest water?
- Pamlico County, with a median of 470 mg/L as CaCO₃ across 328 measurements.
- Is well water harder than city water in North Carolina?
- Groundwater measures harder here — about 3.1× the surface water — so wells tend to run harder (groundwater 80 vs surface water 26 mg/L).
- How do I find my exact hardness in North Carolina?
- Search your ZIP on the lookup tool, read your utility's Consumer Confidence Report, or test at home with a kit.
- Is North Carolina's water harder than the national average?
- No. North Carolina's median of 27 mg/L is below the national county median of 140 mg/L; it ranks #44 of the 50 states and D.C.
Compare
States with similar hardness
Two states measure closest to North Carolina's 27 mg/L: New York at 27 mg/L and Georgia at 24.4 mg/L. North Carolina measures harder than 14% of states. Browse the full ranking on the statistics page.
More: hardness scale · check your address · national statistics · the national map.
By Marko Visic, MPharm, BSc Physics. Source: USGS/EPA Water Quality Portal — 79,363 North Carolina measurements. Data last verified . Methodology.
Cite this page: “North Carolina Water Hardness by County.” Hard Water Map. Retrieved 2026-07-22, https://hardwatermap.com/water-hardness/north-carolina/