Virginia Water Hardness by County
Water in Virginia has a median hardness of 42 mg/L as CaCO₃ — "soft" on the USGS scale — based on 53,216 measurements at 5,085 monitoring stations. Bristol County has the state's hardest measured water (230 mg/L); Madison County the softest (11). Rank: #41 of the 50 states and D.C.
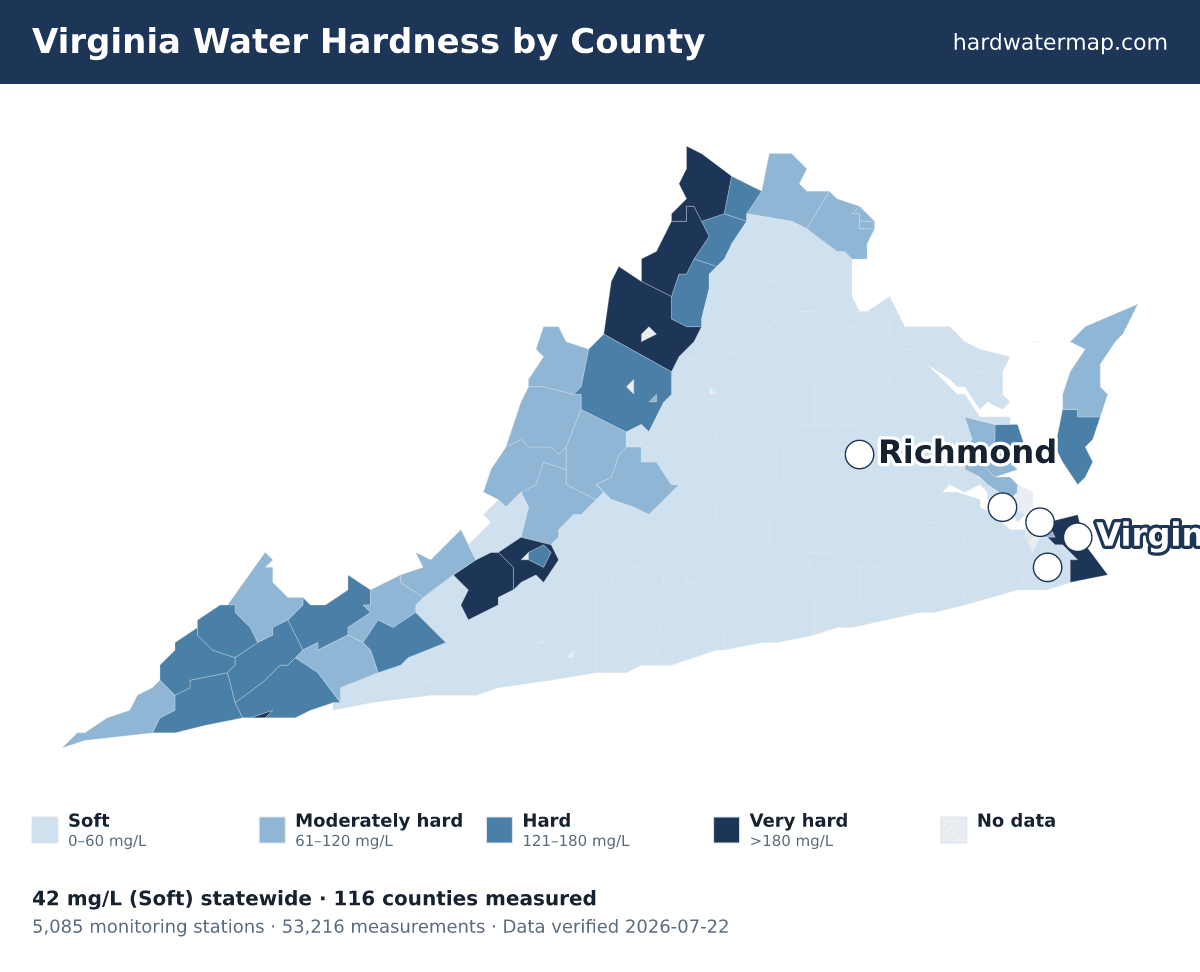
Virginia water hardness map — what the numbers mean. Data verified 2026-07-22.
Of Virginia's 116 measured counties, 8 very hard, 14 hard, 23 moderately hard, and 71 soft. The hardest are Bristol County (230 mg/L), Montgomery County (204.5), and Lexington County (200.5). Madison County is the softest at 11 mg/L (soft).
About 17% of Virginia's roughly 8.1 million residents in counties with gate-passing hardness data live where tap water is hard or worse.
Statewide, Virginia's median works out to 2.5 grains per gallon and ranks #41 of the 50 states and D.C. Across 53,216 measurements at 5,085 stations — 36,418 of them since 2000 — the middle 80% of readings fall between 15 and 181 mg/L. The public record runs from 1906 to 2026.
See where Virginia sits nationally on the national map, or what its number means on the hardness scale.
Download the Virginia water hardness map (PNG) — Water hardness by county in Virginia: 116 counties mapped from USGS/EPA data, statewide median 42 mg/L (soft); darker counties have harder water.
By county
Water hardness by county
The table lists all 116 measured Virginia counties, hardest first. Their medians span 230 mg/L in Bristol County to 11 in Madison County — a 20.9× range. 13 more Virginia counties lack gate-passing data.
| County | Median | Band | Results | Sites | Newest |
|---|---|---|---|---|---|
| Bristol County | 230 | Very hard | 186 | 13 | 2026 |
| Montgomery County | 204.5 | Very hard | 412 | 42 | 2026 |
| Lexington County | 200.5 | Very hard | 32 | 2 | 2017 |
| Frederick County | 200 | Very hard | 243 | 44 | 2026 |
| Shenandoah County | 197 | Very hard | 1,095 | 71 | 2026 |
| Rockingham County | 196 | Very hard | 1,838 | 189 | 2026 |
| Roanoke County | 195.5 | Very hard | 164 | 16 | 2026 |
| Virginia Beach County | 182 | Very hard | 255 | 95 | 2023 |
| Mathews County | 167 | Hard | 15 | 13 | 2018 |
| Dickenson County | 163 | Hard | 533 | 68 | 2026 |
| Wise County | 160 | Hard | 502 | 100 | 2026 |
| Roanoke County | 154.5 | Hard | 134 | 10 | 2018 |
| Clarke County | 145.5 | Hard | 188 | 37 | 2026 |
| Russell County | 145 | Hard | 224 | 40 | 2026 |
| Washington County | 144 | Hard | 737 | 27 | 2026 |
| Tazewell County | 143 | Hard | 354 | 32 | 2026 |
| Scott County | 140 | Hard | 631 | 52 | 2026 |
| Augusta County | 136 | Hard | 566 | 99 | 2026 |
| Northampton County | 130 | Hard | 158 | 108 | 2025 |
| Warren County | 130 | Hard | 1,477 | 33 | 2026 |
| Page County | 121 | Hard | 252 | 49 | 2026 |
| Wythe County | 120 | Hard | 429 | 27 | 2026 |
| Buchanan County | 115.5 | Moderately hard | 1,114 | 261 | 2026 |
| Arlington County | 110 | Moderately hard | 779 | 9 | 2026 |
| Covington County | 107 | Moderately hard | 67 | 3 | 2026 |
| Botetourt County | 104 | Moderately hard | 767 | 46 | 2026 |
| Alexandria County | 103 | Moderately hard | 172 | 10 | 2026 |
| York County | 100.3 | Moderately hard | 144 | 101 | 2019 |
| Lee County | 100 | Moderately hard | 359 | 45 | 2026 |
| Smyth County | 99 | Moderately hard | 599 | 43 | 2026 |
| Accomack County | 98 | Moderately hard | 156 | 96 | 2026 |
| Waynesboro County | 96.5 | Moderately hard | 27 | 10 | 2013 |
| Bland County | 91.4 | Moderately hard | 53 | 14 | 2024 |
| Rockbridge County | 90.5 | Moderately hard | 304 | 51 | 2026 |
| Buena Vista County | 90 | Moderately hard | 9 | 3 | 2022 |
| Gloucester County | 83 | Moderately hard | 89 | 37 | 2021 |
| Norfolk County | 79 | Moderately hard | 14 | 4 | 2010 |
| Alleghany County | 78 | Moderately hard | 850 | 39 | 2026 |
| Radford County | 75.2 | Moderately hard | 98 | 4 | 2026 |
| Bath County | 74.1 | Moderately hard | 173 | 29 | 2026 |
| Amherst County | 71.5 | Moderately hard | 608 | 31 | 2026 |
| Highland County | 67 | Moderately hard | 49 | 16 | 2022 |
| Fairfax County | 65.6 | Moderately hard | 2,529 | 193 | 2026 |
| Giles County | 64 | Moderately hard | 974 | 34 | 2020 |
| Loudoun County | 63 | Moderately hard | 689 | 78 | 2026 |
| Lynchburg County | 59 | Soft | 26 | 3 | 2003 |
| Bedford County | 57 | Soft | 546 | 60 | 2026 |
| Goochland County | 57 | Soft | 1,026 | 20 | 2026 |
| Richmond County | 57 | Soft | 538 | 15 | 2026 |
| Henrico County | 48 | Soft | 1,009 | 65 | 2026 |
| Prince George County | 47.6 | Soft | 415 | 26 | 2026 |
| Chesapeake County | 46.8 | Soft | 136 | 55 | 2026 |
| Craig County | 42.7 | Soft | 79 | 19 | 2026 |
| Pulaski County | 42 | Soft | 616 | 29 | 2026 |
| Surry County | 39 | Soft | 262 | 51 | 2026 |
| Halifax County | 38 | Soft | 1,447 | 38 | 2026 |
| Franklin County | 35 | Soft | 35 | 7 | 2022 |
| Mecklenburg County | 33.7 | Soft | 533 | 27 | 2026 |
| Isle of Wight County | 33 | Soft | 225 | 54 | 2026 |
| James City County | 33 | Soft | 483 | 135 | 2026 |
| Lunenburg County | 33 | Soft | 240 | 12 | 2026 |
| Prince William County | 32.7 | Soft | 1,171 | 183 | 2026 |
| Amelia County | 32 | Soft | 381 | 25 | 2026 |
| Cumberland County | 32 | Soft | 533 | 12 | 2026 |
| Nottoway County | 32 | Soft | 81 | 8 | 2014 |
| Orange County | 32 | Soft | 249 | 31 | 2026 |
| Charlotte County | 31 | Soft | 373 | 18 | 2026 |
| Pittsylvania County | 30.9 | Soft | 972 | 59 | 2026 |
| Prince Edward County | 30.9 | Soft | 220 | 13 | 2026 |
| Lancaster County | 30.8 | Soft | 114 | 28 | 2006 |
| Campbell County | 30.2 | Soft | 389 | 25 | 2020 |
| King and Queen County | 30 | Soft | 287 | 22 | 2023 |
| Petersburg County | 30 | Soft | 140 | 6 | 2026 |
| Southampton County | 29.8 | Soft | 695 | 57 | 2026 |
| Westmoreland County | 29.5 | Soft | 164 | 48 | 2026 |
| King George County | 29 | Soft | 415 | 78 | 2026 |
| Stafford County | 29 | Soft | 688 | 40 | 2026 |
| Charles City County | 28.5 | Soft | 392 | 43 | 2026 |
| Franklin County | 28 | Soft | 1,002 | 59 | 2026 |
| Fauquier County | 27 | Soft | 719 | 57 | 2026 |
| New Kent County | 27 | Soft | 825 | 76 | 2023 |
| Powhatan County | 27 | Soft | 255 | 17 | 2026 |
| Albemarle County | 26.2 | Soft | 452 | 66 | 2026 |
| Chesterfield County | 26 | Soft | 1,029 | 65 | 2026 |
| Middlesex County | 25.3 | Soft | 281 | 22 | 2026 |
| Fluvanna County | 25 | Soft | 434 | 24 | 2026 |
| Sussex County | 25 | Soft | 506 | 63 | 2026 |
| Richmond County | 24.6 | Soft | 320 | 28 | 2026 |
| Brunswick County | 24.2 | Soft | 545 | 31 | 2026 |
| Northumberland County | 24.2 | Soft | 105 | 49 | 2018 |
| Dinwiddie County | 24 | Soft | 313 | 24 | 2026 |
| Essex County | 24 | Soft | 445 | 28 | 2026 |
| Floyd County | 24 | Soft | 81 | 30 | 2026 |
| Spotsylvania County | 24 | Soft | 699 | 24 | 2026 |
| Colonial Heights County | 24 | Soft | 49 | 5 | 2007 |
| Hanover County | 23.8 | Soft | 1,963 | 75 | 2026 |
| Danville County | 23 | Soft | 120 | 6 | 2026 |
| Emporia County | 23 | Soft | 475 | 3 | 2026 |
| Newport News County | 23 | Soft | 151 | 26 | 2026 |
| Greensville County | 22.9 | Soft | 92 | 15 | 2007 |
| Henry County | 22.5 | Soft | 429 | 25 | 2026 |
| Culpeper County | 22 | Soft | 966 | 50 | 2026 |
| Louisa County | 22 | Soft | 417 | 52 | 2026 |
| Caroline County | 21 | Soft | 869 | 64 | 2026 |
| Buckingham County | 20 | Soft | 386 | 22 | 2026 |
| Rappahannock County | 20 | Soft | 285 | 36 | 2026 |
| Nelson County | 19 | Soft | 357 | 40 | 2026 |
| King William County | 18 | Soft | 923 | 80 | 2026 |
| Appomattox County | 17 | Soft | 190 | 21 | 2026 |
| Patrick County | 17 | Soft | 254 | 19 | 2026 |
| Suffolk County | 16.9 | Soft | 321 | 118 | 2026 |
| Williamsburg County | 16.5 | Soft | 14 | 6 | 2019 |
| Carroll County | 15.1 | Soft | 47 | 18 | 2014 |
| Grayson County | 15 | Soft | 498 | 18 | 2026 |
| Greene County | 13 | Soft | 116 | 23 | 2026 |
| Madison County | 11 | Soft | 287 | 39 | 2026 |
ZIP codes
ZIP codes in Virginia
The ZIP codes below are grouped by the Virginia county each mostly falls within (by land area). Each ZIP takes that county's measured median — shown in the group header — so this is a ZIP-to-county guide, not a separate reading for every ZIP. To check the water system serving a specific address, use the lookup.
Key: a † after a ZIP means it has no mapped community water system — usually a private-well area. Plain ZIPs are served by a mapped community water system.
Bristol County · 230 mg/L · Very hard
24201
Montgomery County · 204.5 mg/L · Very hard
24060240612407324087†24138†24149†24162†
Frederick County · 200 mg/L · Very hard
22602†22603†22624†22625†22637†22645†22654†2265522656†
Shenandoah County · 197 mg/L · Very hard
22641†22644†22652†22657†22660†22664†22810†22824†22842†22844†22845†22847†
Rockingham County · 196 mg/L · Very hard
22801†22802†22811†22812†22815†22820†22821†22827†22830†22831†22832†22834†22840†22841†22846†22850†22853†24471†
Roanoke County · 195.5 mg/L · Very hard
24014†240182401924020†24059†24070†24153
Virginia Beach County · 182 mg/L · Very hard
23451234522345323454234552345623457†2345923460234612346223464
Mathews County · 167 mg/L · Hard
23021†23025†23035†23045†23050†23056†23066†23068†23076†23109†23119†23128†23130†23138†23163†
Dickenson County · 163 mg/L · Hard
24217†24220†24226†24228†24237†24256†24269†24272†
Wise County · 160 mg/L · Hard
24216†24219†24230†2424624273†24279†24283†24293
Roanoke County · 154.5 mg/L · Hard
24011240122401324015240162401724022
Clarke County · 145.5 mg/L · Hard
20130†20135†2261122620†22646†22663†
Russell County · 145 mg/L · Hard
24224†24225†24260†24266†24280†24649†
Washington County · 144 mg/L · Hard
24202†24210†24211†24236†24270†2432724340†24361
Tazewell County · 143 mg/L · Hard
24316†24377†24601†24602†24604†24605†24606†2460924612†24613†24630†24635†24637†24641†24651†
Scott County · 140 mg/L · Hard
2424424245†24250†24251†24258†2427124290
Augusta County · 136 mg/L · Hard
22843†2293922952†22980†2440124411†24421†24430†24431†24432†24437†24440†24441†24459†2446724469†24476†2447724479†2448224485†24486†
Northampton County · 130 mg/L · Hard
23307†23310†23316†23347†23350†23354†23398†23405†23408†23413†23486†
Warren County · 130 mg/L · Hard
22610†22630†22642†
Page County · 121 mg/L · Hard
22650†2283522849†22851†
Wythe County · 120 mg/L · Hard
24313†24322†24323†24350†24360†2436824374†24382
Buchanan County · 115.5 mg/L · Moderately hard
24239†24603†24607†24614†24620†24622†24631†24634†24639†24646†24656†24657†
Arlington County · 110 mg/L · Moderately hard
2220122202222032220422205222062220722209222112221322214†
Botetourt County · 104 mg/L · Moderately hard
24066240772408324085†24090†24175†
Alexandria County · 103 mg/L · Moderately hard
223012230222304223052231122314
York County · 100.3 mg/L · Moderately hard
23690†23691236922369323696
Lee County · 100 mg/L · Moderately hard
24221†24243†24248†24263†24265†24277†24281†24282†
Smyth County · 99 mg/L · Moderately hard
243112431924354†24370†24375†
Accomack County · 98 mg/L · Moderately hard
23301†23302†2330323306†23308†23336†23337†23356†23357†23358†23359†23389†23395†23401†23407†23409†23410†23414†23415†23416†23417†23418†23420†23421†23422†23423†23426†23427†23440†23441†23442†23480†23488†
Bland County · 91.4 mg/L · Moderately hard
24314†24315†24318†24366†
Rockbridge County · 90.5 mg/L · Moderately hard
24415†2441624435†24439†24450†24472†24473†24483†24555†24578†24579†
Gloucester County · 83 mg/L · Moderately hard
23061†23062†23072†
Norfolk County · 79 mg/L · Moderately hard
2350223503235042350523507235082350923510235112351323517235182352323551
Alleghany County · 78 mg/L · Moderately hard
24422†24426†244482445724474
Radford County · 75.2 mg/L · Moderately hard
24142
Bath County · 74.1 mg/L · Moderately hard
24412†24445†24460†24484†
Amherst County · 71.5 mg/L · Moderately hard
24521†2457224574†24595†
Highland County · 67 mg/L · Moderately hard
24413†24433†24442†24458†24465†24487†
Fairfax County · 65.6 mg/L · Moderately hard
201202012120124†20151†20170†2017120190201912019422003220152202722030†2203122032220332203522039†220412204222043220442206022066†22079221012210222124221502215122152221532218022181221822230322306223072230822309223102231222315
Giles County · 64 mg/L · Moderately hard
24086†24093†24124†24128†24134†2413624147†24150†24167†
Loudoun County · 63 mg/L · Moderately hard
20105†20117†20129†20132†201412014720148201522015820164201652016620175†20176†2018020184†20197†
Lynchburg County · 59 mg/L · Soft
2450224515†
Bedford County · 57 mg/L · Soft
24064†24095†24104†24121†24122†24174†24179†245032452324526†24536†24551†24556†24570†
Goochland County · 57 mg/L · Soft
23038†23039†23063†23065†23102†23103†23129†23153†23238
Richmond County · 57 mg/L · Soft
231732321923220232212322423225232262328423298
Henrico County · 48 mg/L · Soft
23060230752315023222232232322723228232292323023231232332325023294
Prince George County · 47.6 mg/L · Soft
2380123805†23842†23860†23875†
Chesapeake County · 46.8 mg/L · Soft
233202332123322†23323†2332423325
Craig County · 42.7 mg/L · Soft
24127†24131†
Pulaski County · 42 mg/L · Soft
24058†24084†2412924132†2414124301†24324†24347†
Surry County · 39 mg/L · Soft
23839†23846†23881†23883†23899
Halifax County · 38 mg/L · Soft
24520†24534†24539†24558†24577†24589†24592†24594†24597†24598†
Mecklenburg County · 33.7 mg/L · Soft
23915†23917†2391923924†23927†23950†23968†23970†24529†24580†
Isle of Wight County · 33 mg/L · Soft
2330423314†23315†23430†23487†23898†
James City County · 33 mg/L · Soft
23081†23168†23185†23188
Lunenburg County · 33 mg/L · Soft
23944†23947†23952†23974†
Prince William County · 32.7 mg/L · Soft
2010920111†201122013620143†2015520169†20181†22025†220262212522172†221912219222193
Amelia County · 32 mg/L · Soft
23002†23083†
Cumberland County · 32 mg/L · Soft
23027†23040†23901†
Nottoway County · 32 mg/L · Soft
23824†23922†23930†23955†
Orange County · 32 mg/L · Soft
22433†22508†22542†22567†22957†22960†22972†
Charlotte County · 31 mg/L · Soft
23923†23937†23959†23962†23963†23964†23967†23976†
Pittsylvania County · 30.9 mg/L · Soft
24069†24139†24161†24527†24530†24531†24540†24541†24549†24557†24563†24565†24566†24569†24586†
Prince Edward County · 30.9 mg/L · Soft
2390923934†23942†2394323954†23960†23966†
Lancaster County · 30.8 mg/L · Soft
2248022503†22576†22578†
Campbell County · 30.2 mg/L · Soft
24501†24504†24517†24528†24538†24550†24554†24571†24588†
King and Queen County · 30 mg/L · Soft
22437†23023†23085†23091†23108†23110†23126†23148†23156†23161†23177†
Southampton County · 29.8 mg/L · Soft
23827†23828†23829†23837†23844†23851†23866†23874†23878†
Westmoreland County · 29.5 mg/L · Soft
22443†22469†22488†22520†22529†
King George County · 29 mg/L · Soft
22448†22485†
Stafford County · 29 mg/L · Soft
221342240522406†2255422556†
Charles City County · 28.5 mg/L · Soft
23030†23147†
Franklin County · 28 mg/L · Soft
24065†24067†24088†24092†24101†24102†24137†24151†24176†24184†
Fauquier County · 27 mg/L · Soft
20115†20119†20137†20144†2018620187†20198†22639†22643†22712†22720†22728†2273422742†
New Kent County · 27 mg/L · Soft
23011†23089†2312423140†23141†
Powhatan County · 27 mg/L · Soft
23139†23160†
Albemarle County · 26.2 mg/L · Soft
22901†22902†22903†2290422911†22923†22931†22932†22936†22937†22940†22943†22946†22947†22959†
Chesterfield County · 26 mg/L · Soft
2311223113†2311423120†232342323523236232372383123832†23834†2383623838
Middlesex County · 25.3 mg/L · Soft
23032†23043†23070†23071†23079†23092†23149†23169†23175†23176†23180†
Fluvanna County · 25 mg/L · Soft
22963†22974†23022†23055†23084†
Sussex County · 25 mg/L · Soft
23867†23882†23884†23888†23890†23891†23897†
Richmond County · 24.6 mg/L · Soft
224602247222548†22572†
Brunswick County · 24.2 mg/L · Soft
23821†23843†23845†23856†23857†23868†23876†23887†23889†23893†23920†23938†
Northumberland County · 24.2 mg/L · Soft
22432†22435†22473†22482†22511†22539†
Dinwiddie County · 24 mg/L · Soft
2380323830†23833†23840†23841†23850†2387223885†23894†
Essex County · 24 mg/L · Soft
22436†22438†22454†22476†22504†22509†22560†
Floyd County · 24 mg/L · Soft
24072†24079†24091†24105†24380†
Spotsylvania County · 24 mg/L · Soft
224072240822534†22551†22553†
Hanover County · 23.8 mg/L · Soft
2300523015†23047†23059†23069†231112311623146†23192†
Newport News County · 23 mg/L · Soft
236012360223603†23604†23605236062360723608
Greensville County · 22.9 mg/L · Soft
2384723870†23879†
Henry County · 22.5 mg/L · Soft
24054†240552407824089†2411224148†24165†24168†
Culpeper County · 22 mg/L · Soft
22701†22713†22714†22718†22724†22726†22729†22733†22736†22737†22741†22746†
Louisa County · 22 mg/L · Soft
22942†23024†23093†23117†
Caroline County · 21 mg/L · Soft
22427†22514†22535†22538†22546†22580†
Buckingham County · 20 mg/L · Soft
23004†23123†23921†23936†24553†24562†24590†24599†
Rappahannock County · 20 mg/L · Soft
20106†22623†22627†22640†22716†22740†22747†22749†
Nelson County · 19 mg/L · Soft
22920†22922†22938†22949†22958†22964†22967†2296922971†22976†24464†24581†
King William County · 18 mg/L · Soft
23009†23086†2310623181†
Appomattox County · 17 mg/L · Soft
23958†24522†24593†
Patrick County · 17 mg/L · Soft
24053†24076†24082†24120†24133†24171†24185†
Suffolk County · 16.9 mg/L · Soft
23432†2343323434†234352343623437†23438†
Carroll County · 15.1 mg/L · Soft
24312†24317†24325†24328†24343†24351†24352†24381†
Grayson County · 15 mg/L · Soft
24292†24326†24330†24333†24348†24363†24378†
Greene County · 13 mg/L · Soft
22935†22968†22973†
Madison County · 11 mg/L · Soft
22709†22711†22715†22719†22722†22723†22725†22727†22730†22731†22732†22735†22738†22743†22948†22989†
† 654 ZIP codes are not served by a mapped community water system — most are private-well areas. See well water hardness.
Source
Groundwater vs surface water
Virginia's groundwater measures harder than its surface water — 67.4 mg/L across 3,129 samples versus 41.5 across 49,804, about 1.6× harder. Wells draw from groundwater, so well owners in Virginia tend to see the harder number — 67.4 mg/L, moderately hard. Groundwater readings there run 6 to 262 mg/L across the middle 80% of samples. The comparison draws on 1,907 groundwater and 3,029 surface-water monitoring sites; 131 readings above 2,000 mg/L were logged but held out of the medians as outliers.
Groundwater (wells)
67.4 mg/L as CaCO₃ · 3,129 results at 1,907 stations.
Surface water (rivers, lakes)
41.5 mg/L as CaCO₃ · 49,804 results at 3,029 stations.
Groundwater measures about 1.6× harder than surface water here.
Chemistry
Water chemistry in Virginia
Beyond the hardness number, Virginia's water carries a fuller chemical signature — here is how its measured parameters compare to national benchmarks.
TDS
182 mg/L · n=4,250
182 mg/L — below the national county median of 226.
pH
7.3 pH · n=111,511
pH 7.3 — within the EPA secondary range of 6.5–8.5, on the alkaline side.
Alkalinity
56.2 mg/L as CaCO3 · n=13,658
56.2 mg/L — modest buffering capacity.
Calcium : Magnesium
14.4 : 5.2 mg/L ≈ 2.77 : 1 · n=11,686
Calcium is about 63% of Virginia's hardness (14.4 mg/L Ca to 5.2 mg/L Mg), a little more magnesium-rich than the national ~68% calcium share.
Parameter medians may include a small share of quality-control samples; the hardness lane is fully QC-filtered.
Aquifers
Major aquifers under Virginia
3 aquifer systems supply much of Virginia's measured groundwater.
- Early Mesozoic basin aquifers — median 209.5 mg/L across 26 samples at 18 sites: very hard.
- Valley and Ridge aquifers — median 202 mg/L across 298 samples at 93 sites: very hard.
- Northern Atlantic Coastal Plain aquifer system — median 90 mg/L across 832 samples at 353 sites: moderately hard.
Together these systems account for 1,156 measured samples at 464 sites. Aquifer medians pool samples across a whole system and can mask local variation — see the national aquifer map for how these compare across states.
Trend
Hardness over time
Virginia's decade median moved from 40.5 mg/L in the 1920s to 37 in the 2020s. Over the series, the decade median peaked at 56 mg/L in the 1950s and bottomed at 30 in the 1930s. Decade medians reflect where and what agencies sampled in each era, not just changes in the water itself.
Scale
Where Virginia sits on the scale
On the USGS scale, Virginia's 42 mg/L is soft — 2.5 grains per gallon, below the 60 mg/L soft cutoff — among the softest water measured in the US.
Questions
Frequently asked questions
- Is Virginia's water hard?
- Virginia's median hardness is 42 mg/L as CaCO₃, "soft" on the USGS scale and below the national county median of 140 mg/L.
- Which county in Virginia has the hardest water?
- Bristol County, with a median of 230 mg/L as CaCO₃ across 186 measurements.
- Is well water harder than city water in Virginia?
- Groundwater measures harder here — about 1.6× the surface water — so wells tend to run harder (groundwater 67.4 vs surface water 41.5 mg/L).
- How do I find my exact hardness in Virginia?
- Search your ZIP on the lookup tool, read your utility's Consumer Confidence Report, or test at home with a kit.
- Is Virginia's water harder than the national average?
- No. Virginia's median of 42 mg/L is below the national county median of 140 mg/L; it ranks #41 of the 50 states and D.C.
Compare
States with similar hardness
Two states measure closest to Virginia's 42 mg/L: Connecticut at 42.9 mg/L and Massachusetts at 43.7 mg/L. Virginia measures harder than 20% of states. Browse the full ranking on the statistics page.
More: hardness scale · check your address · national statistics · the national map.
By Marko Visic, MPharm, BSc Physics. Source: USGS/EPA Water Quality Portal — 53,216 Virginia measurements. Data last verified . Methodology.
Cite this page: “Virginia Water Hardness by County.” Hard Water Map. Retrieved 2026-07-22, https://hardwatermap.com/water-hardness/virginia/