Arkansas Water Hardness by County
Water in Arkansas has a median hardness of 62 mg/L as CaCO₃ — "moderately hard" on the USGS scale — based on 96,699 measurements at 6,139 monitoring stations. Fulton County has the state's hardest measured water (220 mg/L); Perry County the softest (12). Rank: #33 of the 50 states and D.C.
Arkansas water hardness map — what the numbers mean. Data verified 2026-07-22.
Of Arkansas's 75 measured counties, 3 very hard, 13 hard, 24 moderately hard, and 35 soft. The hardest are Fulton County (220 mg/L), Sharp County (205), and Lawrence County (195). Perry County is the softest at 12 mg/L (soft).
About 12% of Arkansas's roughly 3 million residents in counties with gate-passing hardness data live where tap water is hard or worse.
Statewide, Arkansas's median works out to 3.6 grains per gallon and ranks #33 of the 50 states and D.C. Across 96,699 measurements at 6,139 stations — 42,995 of them since 2000 — the middle 80% of readings fall between 12.3 and 193 mg/L. The public record runs from 1928 to 2026.
See where Arkansas sits nationally on the national map, or what its number means on the hardness scale.
Download the Arkansas water hardness map (PNG) — Water hardness by county in Arkansas: 75 counties mapped from USGS/EPA data, statewide median 62 mg/L (moderately hard); darker counties have harder water.
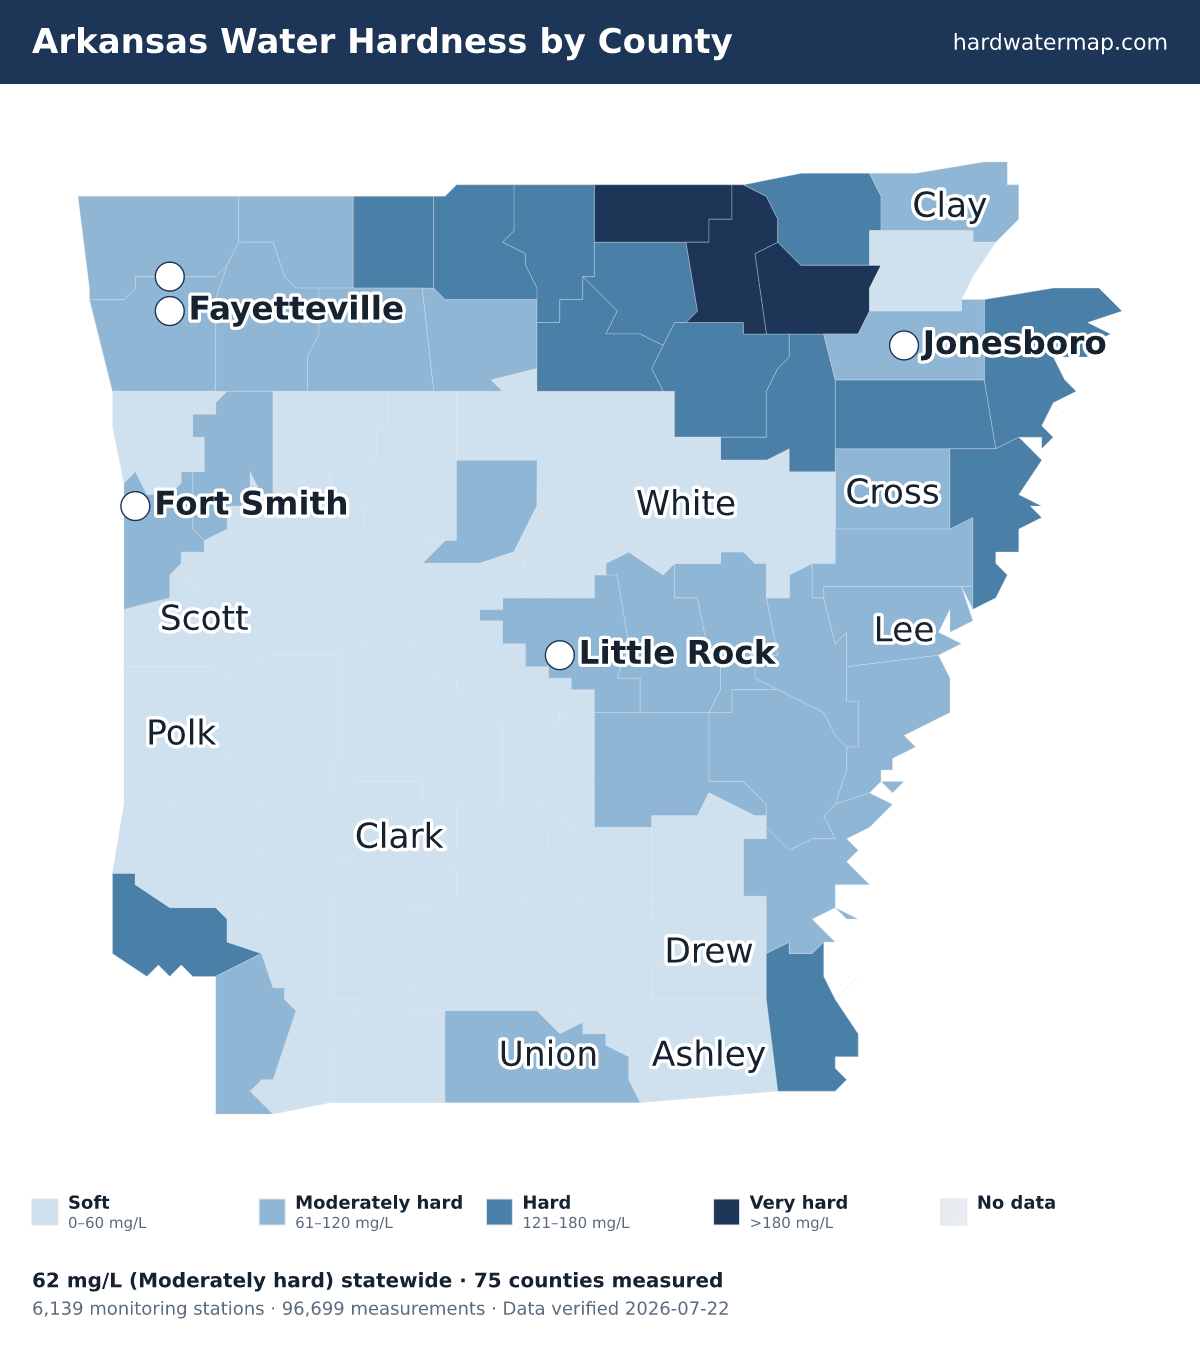
By county
Water hardness by county
The table lists all 75 measured Arkansas counties, hardest first. Their medians span 220 mg/L in Fulton County to 12 in Perry County — a 18.3× range.
| County | Median | Band | Results | Sites | Newest |
|---|---|---|---|---|---|
| Fulton County | 220 | Very hard | 1,084 | 41 | 2026 |
| Sharp County | 205 | Very hard | 863 | 64 | 2026 |
| Lawrence County | 195 | Very hard | 1,233 | 55 | 2026 |
| Boone County | 173 | Hard | 1,137 | 110 | 2026 |
| Crittenden County | 170 | Hard | 299 | 105 | 2026 |
| Mississippi County | 170 | Hard | 445 | 118 | 2026 |
| Poinsett County | 170 | Hard | 563 | 51 | 2026 |
| Randolph County | 170 | Hard | 1,817 | 44 | 2026 |
| Baxter County | 160 | Hard | 2,436 | 34 | 2026 |
| Izard County | 149 | Hard | 557 | 25 | 2026 |
| Jackson County | 140 | Hard | 1,163 | 49 | 2026 |
| Little River County | 140 | Hard | 1,356 | 41 | 2025 |
| Marion County | 138 | Hard | 1,574 | 48 | 2026 |
| Stone County | 137.5 | Hard | 1,004 | 34 | 2026 |
| Independence County | 137 | Hard | 753 | 50 | 2025 |
| Chicot County | 120 | Hard | 307 | 89 | 2026 |
| Carroll County | 118 | Moderately hard | 2,854 | 65 | 2026 |
| Sebastian County | 118 | Moderately hard | 1,417 | 52 | 2026 |
| Benton County | 110 | Moderately hard | 3,779 | 158 | 2026 |
| Prairie County | 110 | Moderately hard | 1,055 | 83 | 2026 |
| Cross County | 108 | Moderately hard | 593 | 43 | 2026 |
| Searcy County | 108 | Moderately hard | 1,020 | 51 | 2026 |
| Clay County | 103 | Moderately hard | 623 | 41 | 2026 |
| Arkansas County | 100 | Moderately hard | 1,416 | 127 | 2026 |
| Lee County | 98 | Moderately hard | 499 | 45 | 2026 |
| Monroe County | 98 | Moderately hard | 1,790 | 155 | 2026 |
| Phillips County | 95.8 | Moderately hard | 142 | 32 | 2026 |
| St. Francis County | 95 | Moderately hard | 1,019 | 62 | 2026 |
| Franklin County | 89.3 | Moderately hard | 788 | 58 | 2026 |
| Miller County | 86 | Moderately hard | 1,587 | 80 | 2025 |
| Madison County | 84.7 | Moderately hard | 1,246 | 29 | 2026 |
| Washington County | 84 | Moderately hard | 4,402 | 85 | 2026 |
| Newton County | 83.8 | Moderately hard | 503 | 45 | 2023 |
| Desha County | 80.5 | Moderately hard | 809 | 154 | 2026 |
| Lonoke County | 78.1 | Moderately hard | 611 | 190 | 2026 |
| Craighead County | 75 | Moderately hard | 1,064 | 82 | 2026 |
| Jefferson County | 75 | Moderately hard | 1,993 | 221 | 2026 |
| Conway County | 74.1 | Moderately hard | 848 | 112 | 2026 |
| Union County | 66 | Moderately hard | 4,434 | 141 | 2026 |
| Pulaski County | 62.5 | Moderately hard | 4,940 | 203 | 2025 |
| Pope County | 57.7 | Soft | 3,477 | 136 | 2026 |
| Woodruff County | 55.4 | Soft | 1,086 | 90 | 2026 |
| Saline County | 51.3 | Soft | 2,158 | 59 | 2025 |
| Lincoln County | 45.2 | Soft | 584 | 142 | 2026 |
| Greene County | 45 | Soft | 87 | 26 | 2026 |
| Faulkner County | 40 | Soft | 1,265 | 130 | 2026 |
| Dallas County | 39.9 | Soft | 752 | 36 | 2026 |
| Grant County | 38 | Soft | 1,118 | 55 | 2025 |
| Ashley County | 30 | Soft | 769 | 53 | 2026 |
| Lafayette County | 30 | Soft | 732 | 35 | 2025 |
| Drew County | 29.4 | Soft | 509 | 132 | 2025 |
| Cleveland County | 28 | Soft | 555 | 20 | 2025 |
| Hempstead County | 28 | Soft | 604 | 110 | 2025 |
| Bradley County | 26 | Soft | 717 | 76 | 2026 |
| Clark County | 26 | Soft | 1,898 | 86 | 2025 |
| Hot Spring County | 24.4 | Soft | 1,918 | 110 | 2025 |
| Garland County | 24 | Soft | 1,072 | 104 | 2025 |
| Nevada County | 24 | Soft | 679 | 63 | 2023 |
| Logan County | 23 | Soft | 1,129 | 72 | 2026 |
| Ouachita County | 22.9 | Soft | 1,159 | 155 | 2025 |
| Montgomery County | 22 | Soft | 1,207 | 31 | 2026 |
| Columbia County | 20.8 | Soft | 598 | 69 | 2025 |
| Scott County | 19.9 | Soft | 1,320 | 35 | 2026 |
| Johnson County | 19.1 | Soft | 356 | 56 | 2024 |
| Crawford County | 18 | Soft | 784 | 148 | 2026 |
| White County | 18 | Soft | 893 | 69 | 2026 |
| Yell County | 17.7 | Soft | 1,921 | 225 | 2026 |
| Cleburne County | 17 | Soft | 1,306 | 49 | 2024 |
| Sevier County | 17 | Soft | 2,634 | 76 | 2026 |
| Howard County | 16 | Soft | 2,346 | 118 | 2026 |
| Pike County | 16 | Soft | 957 | 53 | 2025 |
| Polk County | 14.2 | Soft | 1,234 | 38 | 2026 |
| Van Buren County | 13.6 | Soft | 1,296 | 108 | 2026 |
| Calhoun County | 12 | Soft | 424 | 73 | 2026 |
| Perry County | 12 | Soft | 1,132 | 29 | 2026 |
ZIP codes
ZIP codes in Arkansas
The ZIP codes below are grouped by the Arkansas county each mostly falls within (by land area). Each ZIP takes that county's measured median — shown in the group header — so this is a ZIP-to-county guide, not a separate reading for every ZIP. To check the water system serving a specific address, use the lookup.
Key: a † after a ZIP means it has no mapped community water system — usually a private-well area. Plain ZIPs are served by a mapped community water system.
Fulton County · 220 mg/L · Very hard
72515†72520†72531†72538†72539†72554†72576†72578†72583†
Sharp County · 205 mg/L · Very hard
72482†72513†725217252972532†72542†72569
Lawrence County · 195 mg/L · Very hard
72410724157243372440†72445724577245872466†7246972476†72572
Boone County · 173 mg/L · Hard
72601726157263072644†72662†
Crittenden County · 170 mg/L · Hard
7230172325†7232772331723327233972348†723647237672384†
Mississippi County · 170 mg/L · Hard
72313†7231572329†72330†72350†723517235872370†7239172395†72426724287243872442
Poinsett County · 170 mg/L · Hard
7235472365†72377†72386†724297243272472†72479†
Randolph County · 170 mg/L · Hard
72413†7243472444†7244972455†72459†72460†72462†72478†
Baxter County · 160 mg/L · Hard
72519†72537†72544†72617†72623†72626†72635†72642726517265372658†
Izard County · 149 mg/L · Hard
7251272517†7252872536†725407255672561†7256572566†7257372577†7258472585†72587†
Jackson County · 140 mg/L · Hard
72005†7201472020720757211272169†7243172471†72473†
Little River County · 140 mg/L · Hard
71820†718227183671853†7186571866†
Marion County · 138 mg/L · Hard
726197263372634†7266172668†72672†72677†7268272687
Stone County · 137.5 mg/L · Hard
72051725337255572560725677266372680†
Independence County · 137 mg/L · Hard
7216572501725227252472526725277253472550725537256272564†7256872571†72579
Chicot County · 120 mg/L · Hard
71640†71653†71663†
Carroll County · 118 mg/L · Moderately hard
72611†7261672631†726327263872660†
Sebastian County · 118 mg/L · Moderately hard
72901729037290472905†72908729167292372936729377293872940729417294472945
Benton County · 110 mg/L · Moderately hard
7271272713†727147271572718727197272272732727347273672739727457274772751727567275872761†72768†
Prairie County · 110 mg/L · Moderately hard
7201772040†720417206472066†72170
Cross County · 108 mg/L · Moderately hard
7232472347†72373†7238772396
Searcy County · 108 mg/L · Moderately hard
7263672639†72645†72650†7266972675†72679†
Clay County · 103 mg/L · Moderately hard
72422†724247243072435†7244172453†7245472456724617246472470
Arkansas County · 100 mg/L · Moderately hard
7200372026†720387204272048†7205572073721407216072166†
Lee County · 98 mg/L · Moderately hard
723117232072341†7235272360†72368†
Monroe County · 98 mg/L · Moderately hard
7202172029†72069†7210872134†
Phillips County · 95.8 mg/L · Moderately hard
72333†72342†72353†723557236672367†72369†72374†72383†72389†72390†
St. Francis County · 95 mg/L · Moderately hard
7232272326†7233572340†72346†723597237272392†72394
Franklin County · 89.3 mg/L · Moderately hard
7282172928†72930729337294772949
Miller County · 86 mg/L · Moderately hard
71834†71837†71839†71854†
Madison County · 84.7 mg/L · Moderately hard
7272172727†727387274072742†72752†72760†7277372776
Washington County · 84 mg/L · Moderately hard
7270172703†727047271772729727307274472749727537276272764727697277472959†
Newton County · 83.8 mg/L · Moderately hard
72624726287264072641†72648†72655†7266672670†7268372685†72856†
Desha County · 80.5 mg/L · Moderately hard
71630†71654†71662†71666†71670†71674†72328†72379
Lonoke County · 78.1 mg/L · Moderately hard
72007720237202472046720727208372086†7214272176
Craighead County · 75 mg/L · Moderately hard
7240172404†7240572411†72414†72416†724177241972421724277243772447†72467
Jefferson County · 75 mg/L · Moderately hard
71601†7160271603†7165972004†72079721327213372152†72168†7217572182†
Conway County · 74.1 mg/L · Moderately hard
7202772030†72063721077211072127†72156†72157
Union County · 66 mg/L · Moderately hard
717247173071747†71749†71758†7175971762†71765†
Pulaski County · 62.5 mg/L · Moderately hard
7205372076720997211372114721167211772118721197212072135721807218372199722017220272204722057220672207722097221072211722127222372227
Pope County · 57.7 mg/L · Soft
72686†7280172802†72823†72837†72843†72847†72858†
Woodruff County · 55.4 mg/L · Soft
72006†720367205972074†72101†72123
Saline County · 51.3 mg/L · Soft
720027201172015†72019†7202272065†720877210372122†72167†
Lincoln County · 45.2 mg/L · Soft
71639†71643†71644†7166771678
Greene County · 45 mg/L · Soft
724127242572436†7244372450
Faulkner County · 40 mg/L · Soft
72032720347203572039†72047†720587206172106721117217372181
Dallas County · 39.9 mg/L · Soft
71725†71742†717487176372084
Grant County · 38 mg/L · Soft
72057721287212972150
Ashley County · 30 mg/L · Soft
71635†71642†71646†71658†71661†71676†
Lafayette County · 30 mg/L · Soft
71826†71827†71845†71860†71861
Drew County · 29.4 mg/L · Soft
71638†7165571675†71677†
Cleveland County · 28 mg/L · Soft
716527166071665†
Hempstead County · 28 mg/L · Soft
718017182571838†7184771855†71859†71862†
Bradley County · 26 mg/L · Soft
71631716477165171671
Clark County · 26 mg/L · Soft
717217172871743†71772719217192371962†7199871999
Hot Spring County · 24.4 mg/L · Soft
7192971941†71942†72104
Garland County · 24 mg/L · Soft
71901†71909719137193371949719567196471968
Nevada County · 24 mg/L · Soft
71722†71835†718577185871864
Logan County · 23 mg/L · Soft
7282672835†72851†72855†72863†72865729277294372951
Ouachita County · 22.9 mg/L · Soft
71701717207172671751†71764†
Montgomery County · 22 mg/L · Soft
71935†7195771960†71961†71965†71969†71970†
Columbia County · 20.8 mg/L · Soft
71740†71752†7175371770
Scott County · 19.9 mg/L · Soft
72841†72926†7295072958
Johnson County · 19.1 mg/L · Soft
728307283272839†7284072845†728467285272854†
Crawford County · 18 mg/L · Soft
729217293272934†7293572946†72948†729527295572956
White County · 18 mg/L · Soft
72010†72012720457205272060†720687208172082720857210272121†7213672137†721397214372178
Yell County · 17.7 mg/L · Soft
7282472827†728287282972833†7283472838†72842†72853†72857†72860
Cleburne County · 17 mg/L · Soft
72044†7206772130†72131†72179†725237253072543†72546†72581
Sevier County · 17 mg/L · Soft
7182371832718417184271846
Howard County · 16 mg/L · Soft
71831†71833†71851†7185271971
Pike County · 16 mg/L · Soft
71922†7194071943†71950†71952†7195871959†
Polk County · 14.2 mg/L · Soft
71937†71944719457195371972†71973
Van Buren County · 13.6 mg/L · Soft
72013720287203172080†72088721417215372629†
Calhoun County · 12 mg/L · Soft
717447174571766†
Perry County · 12 mg/L · Soft
72001†72016†72025†72070†7212572126
† 259 ZIP codes are not served by a mapped community water system — most are private-well areas. See well water hardness.
Source
Groundwater vs surface water
Arkansas's groundwater measures harder than its surface water — 150 mg/L across 5,656 samples versus 60 across 90,927, about 2.5× harder. Wells draw from groundwater, so well owners in Arkansas tend to see the harder number — 150 mg/L, hard. Groundwater readings there run 12 to 380 mg/L across the middle 80% of samples. The comparison draws on 4,176 groundwater and 1,958 surface-water monitoring sites; 294 readings above 2,000 mg/L were logged but held out of the medians as outliers.
Groundwater (wells)
150 mg/L as CaCO₃ · 5,656 results at 4,176 stations.
Surface water (rivers, lakes)
60 mg/L as CaCO₃ · 90,927 results at 1,958 stations.
Groundwater measures about 2.5× harder than surface water here.
Chemistry
Water chemistry in Arkansas
Beyond the hardness number, Arkansas's water carries a fuller chemical signature — here is how its measured parameters compare to national benchmarks.
TDS
104 mg/L · n=41,545
104 mg/L — below the national county median of 226.
pH
7.2 pH · n=26,162
pH 7.2 — within the EPA secondary range of 6.5–8.5, on the alkaline side.
Alkalinity
53 mg/L as CaCO3 · n=58,903
53 mg/L — modest buffering capacity.
Calcium : Magnesium
12.2 : 2.5 mg/L ≈ 4.88 : 1 · n=65,736
Calcium is about 75% of Arkansas's hardness (12.2 mg/L Ca to 2.5 mg/L Mg), a little more calcium-rich than the national ~68% calcium share.
Parameter medians may include a small share of quality-control samples; the hardness lane is fully QC-filtered.
Aquifers
Major aquifers under Arkansas
3 aquifer systems supply much of Arkansas's measured groundwater.
- Mississippi River Valley alluvial aquifer — median 240 mg/L across 1,455 samples at 1,176 sites: very hard.
- Alluvial aquifers — median 210 mg/L across 936 samples at 803 sites: very hard.
- Ozark Plateaus aquifer system — median 182 mg/L across 465 samples at 263 sites: very hard.
Together these systems account for 2,856 measured samples at 2,242 sites. Aquifer medians pool samples across a whole system and can mask local variation — see the national aquifer map for how these compare across states.
Trend
Hardness over time
Arkansas's decade median moved from 94 mg/L in the 1940s to 40.3 in the 2020s. Over the series, the decade median peaked at 120 mg/L in the 1950s and bottomed at 40.3 in the 2020s. Decade medians reflect where and what agencies sampled in each era, not just changes in the water itself.
Scale
Where Arkansas sits on the scale
On the USGS scale, Arkansas's 62 mg/L is moderately hard — 3.6 grains per gallon, between the 60 and 120 mg/L soft and hard cutoffs.
Questions
Frequently asked questions
- Is Arkansas's water hard?
- Arkansas's median hardness is 62 mg/L as CaCO₃, "moderately hard" on the USGS scale and below the national county median of 140 mg/L.
- Which county in Arkansas has the hardest water?
- Fulton County, with a median of 220 mg/L as CaCO₃ across 1,084 measurements.
- Is well water harder than city water in Arkansas?
- Groundwater measures harder here — about 2.5× the surface water — so wells tend to run harder (groundwater 150 vs surface water 60 mg/L).
- How do I find my exact hardness in Arkansas?
- Search your ZIP on the lookup tool, read your utility's Consumer Confidence Report, or test at home with a kit.
- Is Arkansas's water harder than the national average?
- No. Arkansas's median of 62 mg/L is below the national county median of 140 mg/L; it ranks #33 of the 50 states and D.C.
Compare
States with similar hardness
Two states measure closest to Arkansas's 62 mg/L: Delaware at 63.9 mg/L and New Jersey at 59.9 mg/L. Arkansas measures harder than 36% of states. Browse the full ranking on the statistics page.
More: hardness scale · check your address · national statistics · the national map.
By Marko Visic, MPharm, BSc Physics. Source: USGS/EPA Water Quality Portal — 96,699 Arkansas measurements. Data last verified . Methodology.
Cite this page: “Arkansas Water Hardness by County.” Hard Water Map. Retrieved 2026-07-22, https://hardwatermap.com/water-hardness/arkansas/