New Jersey Water Hardness by County
Water in New Jersey has a median hardness of 59.9 mg/L as CaCO₃ — "soft" on the USGS scale — based on 44,400 measurements at 5,429 monitoring stations. Hudson County has the state's hardest measured water (920 mg/L); Burlington County the softest (8.6). Rank: #34 of the 50 states and D.C.
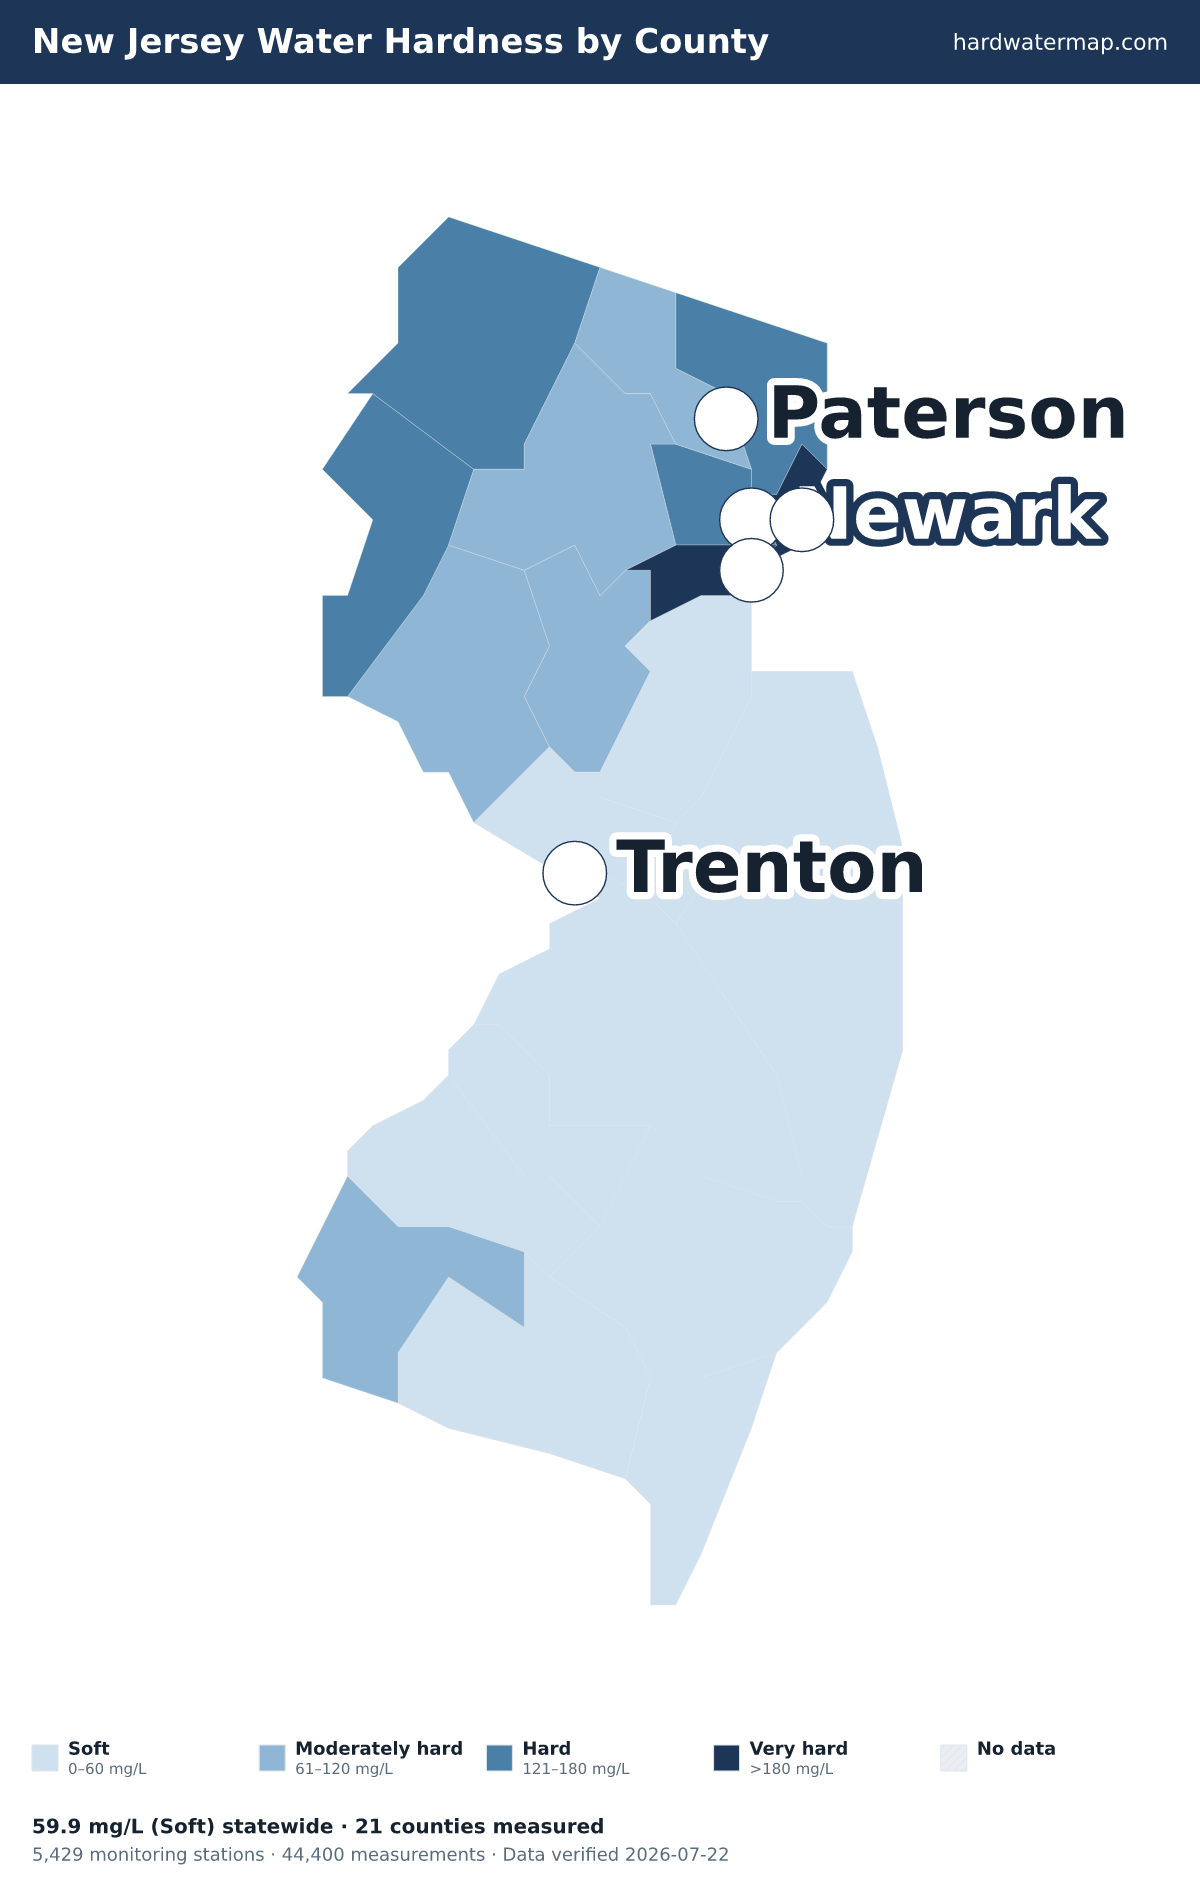
New Jersey water hardness map — what the numbers mean. Data verified 2026-07-22.
Of New Jersey's 21 measured counties, 2 very hard, 4 hard, 5 moderately hard, and 10 soft. The hardest are Hudson County (920 mg/L), Union County (180), and Warren County (137). Burlington County is the softest at 8.6 mg/L (soft).
About 36% of New Jersey's roughly 9.3 million residents in counties with gate-passing hardness data live where tap water is hard or worse.
Statewide, New Jersey's median works out to 3.5 grains per gallon and ranks #34 of the 50 states and D.C. Across 44,400 measurements at 5,429 stations — 16,167 of them since 2000 — the middle 80% of readings fall between 8 and 165 mg/L. The public record runs from 1906 to 2025.
See where New Jersey sits nationally on the national map, or what its number means on the hardness scale.
Download the New Jersey water hardness map (PNG) — Water hardness by county in New Jersey: 21 counties mapped from USGS/EPA data, statewide median 59.9 mg/L (soft); darker counties have harder water.
By county
Water hardness by county
The table lists all 21 measured New Jersey counties, hardest first. Their medians span 920 mg/L in Hudson County to 8.6 in Burlington County — a 107× range.
| County | Median | Band | Results | Sites | Newest |
|---|---|---|---|---|---|
| Hudson County | 920 | Very hard | 60 | 10 | 2022 |
| Union County | 180 | Very hard | 740 | 49 | 2023 |
| Warren County | 137 | Hard | 2,520 | 123 | 2025 |
| Bergen County | 129 | Hard | 1,794 | 211 | 2023 |
| Essex County | 129 | Hard | 596 | 46 | 2023 |
| Sussex County | 120 | Hard | 2,394 | 228 | 2023 |
| Morris County | 82 | Moderately hard | 3,321 | 505 | 2023 |
| Passaic County | 77.9 | Moderately hard | 1,548 | 88 | 2023 |
| Somerset County | 77.5 | Moderately hard | 2,841 | 115 | 2023 |
| Hunterdon County | 73 | Moderately hard | 3,335 | 231 | 2025 |
| Salem County | 65.7 | Moderately hard | 1,542 | 232 | 2025 |
| Mercer County | 58.5 | Soft | 3,522 | 249 | 2025 |
| Gloucester County | 47.4 | Soft | 2,547 | 531 | 2025 |
| Monmouth County | 46 | Soft | 2,162 | 285 | 2023 |
| Camden County | 43 | Soft | 2,848 | 356 | 2023 |
| Middlesex County | 42.8 | Soft | 1,698 | 355 | 2023 |
| Cape May County | 37.3 | Soft | 580 | 180 | 2023 |
| Cumberland County | 33 | Soft | 1,265 | 201 | 2025 |
| Ocean County | 11.6 | Soft | 1,650 | 520 | 2023 |
| Atlantic County | 11 | Soft | 1,572 | 356 | 2023 |
| Burlington County | 8.6 | Soft | 5,585 | 515 | 2025 |
| 280 additional results from sites without county attribution (not shown). | |||||
ZIP codes
ZIP codes in New Jersey
The ZIP codes below are grouped by the New Jersey county each mostly falls within (by land area). Each ZIP takes that county's measured median — shown in the group header — so this is a ZIP-to-county guide, not a separate reading for every ZIP. To check the water system serving a specific address, use the lookup.
Key: a † after a ZIP means it has no mapped community water system — usually a private-well area. Plain ZIPs are served by a mapped community water system.
Hudson County · 920 mg/L · Very hard
07002070290703007032070470708607087070930709407302073040730507306073070731007311†
Union County · 180 mg/L · Very hard
0701607023070270703307036070600706207063070650706607076070810708307088070900709207201072020720307204072050720607208079010792207974
Warren County · 137 mg/L · Hard
07820†07823†0782507831†07832†07833†07838†0784007844†07846†07863†07865†07880†078820886508886†
Bergen County · 129 mg/L · Hard
070100702007022070240702607031070570707007071†0707207073070740707507401074070741007417†0742307430†07432074360744607450074520745807463074810760107603076040760507606076070760807620†07621076240762607627076280763007631076320764007641076420764307644076450764607647076480764907650076520765607657†076600766107662076630766607670076750767607677
Essex County · 129 mg/L · Hard
07003070040700607009070170701807021070280703907040070410704207043070440705007052070680707807079071020710307104071050710607107071080710907110071110711207114
Sussex County · 120 mg/L · Hard
0741607418†0741907422†0743907460†07461†07462†07821†07822†07826†07827†0784307848†07851†07860†078710787407881†
Morris County · 82 mg/L · Moderately hard
07005†0703407035070450704607054070580708207405†07438†07440074440745707801†0780307828†0783407836†07842†0784707849†07850†078520785307856†0785707866†0786907870†07876078780788507926†079270792807930†07932079330793507936079400794507946079500796007961†07970†07976†0798007981
Passaic County · 77.9 mg/L · Moderately hard
070110701207013070140705507403†0742007421†0742407435†0744207456†07465†0747007480†075010750207503075040750507506075080751207513075140752207524
Somerset County · 77.5 mg/L · Moderately hard
07059070690792007921†07924†07931†07934†0793907977†0850208528085530855808805088070881208821†0882308835088360884408853†0886908873088760888008890
Hunterdon County · 73 mg/L · Moderately hard
07830†07979†08530†08551†08559†0880108802†08804†08809†0882208825†08826†08827†0882908833†08848†08858†08867†0888708889†
Salem County · 65.7 mg/L · Moderately hard
08001†08023†08038†08067†080690807008072†08079†0809808318†08343†
Mercer County · 58.5 mg/L · Soft
08520†08525†085340854008542085440855008560†08561†08608086090861008611†086180861908620086280862908638086480869008691
Gloucester County · 47.4 mg/L · Soft
08014†0802008027†08028†0803208039†0805108056080610806208063080660807108074†08080†08085†0808608090080930809408096080970831208322†08328†08344†
Monmouth County · 46 mg/L · Soft
07701077020770307704077110771207716077170771807719077200772107722†07723077240772607727†0772807730077310773207733†0773407735†0773707738077390774007746077480775007751077530775507756077570775807760077620776408501†08510†08514†08535†0855508720087300873608750
Camden County · 43 mg/L · Soft
080020800308004†0800708009080120802108026080290803008031080330803408035080430804508049080590807808081080830808408089†0809108095081020810308104081050810608107081080810908110
Middlesex County · 42.8 mg/L · Soft
070010700807064070670707707080070950774708512†085360881008816088170882008824088280883008831088320883708840088460885008852088540885708859088610886308872088790888208884089010890208904
Cape May County · 37.3 mg/L · Soft
0820208204†082100821208223†08226†08230†082420824308245†08246†0824708248†082510826008270†
Cumberland County · 33 mg/L · Soft
08302†08311†08314†08316†0832008321†08323†08324†08327†08329†08332†08340†08345†08348†08349†08352†08353†0836008361
Ocean County · 11.6 mg/L · Soft
08005†0800608008†08050†08087†08092†08527†08533†0870108721†08722087230872408731†0873208733†0873408735†0873808740†087410874208751†08752†08753087550875708758†08759
Atlantic County · 11 mg/L · Soft
0803708201†08203†08205†08215†08217†08221†08225†0823208234†08240†08241†0824408310†08317†08319†08326†08330†0834108346†08350†08401†0840208403†08406
Burlington County · 8.6 mg/L · Soft
0801008011†08015†0801608019†08022†0803608041†08042†08046080480805208053†0805408055080570806008064†0806508068†08073080750807708088†08224†08505†08511†08515†085180855408562†0864008641
† 184 ZIP codes are not served by a mapped community water system — most are private-well areas. See well water hardness.
Source
Groundwater vs surface water
New Jersey's surface water measures harder than its groundwater — 60.6 mg/L across 36,312 samples versus 54 across 7,889, about 1.1× harder. For well owners that is the better side of a hard bargain: at 54 mg/L, New Jersey groundwater is still soft, and most of the state's drinking water is pumped from it. Groundwater readings there run 5.5 to 223 mg/L across the middle 80% of samples. The comparison draws on 4,015 groundwater and 1,373 surface-water monitoring sites; 298 readings above 2,000 mg/L were logged but held out of the medians as outliers.
Groundwater (wells)
54 mg/L as CaCO₃ · 7,889 results at 4,015 stations.
Surface water (rivers, lakes)
60.6 mg/L as CaCO₃ · 36,312 results at 1,373 stations.
Surface water measures about 1.1× harder than groundwater here.
Chemistry
Water chemistry in New Jersey
Beyond the hardness number, New Jersey's water carries a fuller chemical signature — here is how its measured parameters compare to national benchmarks.
TDS
156 mg/L · n=15,593
156 mg/L — below the national county median of 226.
pH
7.3 pH · n=11,538
pH 7.3 — within the EPA secondary range of 6.5–8.5, on the alkaline side.
Alkalinity
46.8 mg/L as CaCO3 · n=15,560
46.8 mg/L — modest buffering capacity.
Calcium : Magnesium
15.8 : 4.9 mg/L ≈ 3.22 : 1 · n=15,084
Calcium is about 66% of New Jersey's hardness (15.8 mg/L Ca to 4.9 mg/L Mg), a little more magnesium-rich than the national ~68% calcium share.
Parameter medians may include a small share of quality-control samples; the hardness lane is fully QC-filtered.
Aquifers
Major aquifers under New Jersey
3 aquifer systems supply much of New Jersey's measured groundwater.
- Valley and Ridge aquifers — median 178 mg/L across 121 samples at 84 sites: hard.
- Early Mesozoic basin aquifers — median 176 mg/L across 776 samples at 506 sites: hard.
- Sand and gravel aquifers (glaciated regions) — median 157 mg/L across 803 samples at 375 sites: hard.
Together these systems account for 1,700 measured samples at 965 sites. Aquifer medians pool samples across a whole system and can mask local variation — see the national aquifer map for how these compare across states.
Trend
Hardness over time
New Jersey's decade median moved from 50 mg/L in the 1920s to 64.8 in the 2020s. Over the series, the decade median peaked at 67 mg/L in the 1960s and bottomed at 38 in the 1930s. Decade medians reflect where and what agencies sampled in each era, not just changes in the water itself.
Scale
Where New Jersey sits on the scale
On the USGS scale, New Jersey's 59.9 mg/L is soft — 3.5 grains per gallon, below the 60 mg/L soft cutoff — among the softest water measured in the US.
Questions
Frequently asked questions
- Is New Jersey's water hard?
- New Jersey's median hardness is 59.9 mg/L as CaCO₃, "soft" on the USGS scale and below the national county median of 140 mg/L.
- Which county in New Jersey has the hardest water?
- Hudson County, with a median of 920 mg/L as CaCO₃ across 60 measurements.
- Is well water harder than city water in New Jersey?
- Surface water measures harder here — about 1.1× the groundwater — so wells tend to run softer (groundwater 54 vs surface water 60.6 mg/L).
- How do I find my exact hardness in New Jersey?
- Search your ZIP on the lookup tool, read your utility's Consumer Confidence Report, or test at home with a kit.
- Is New Jersey's water harder than the national average?
- No. New Jersey's median of 59.9 mg/L is below the national county median of 140 mg/L; it ranks #34 of the 50 states and D.C.
Compare
States with similar hardness
Two states measure closest to New Jersey's 59.9 mg/L: Maryland at 58 mg/L and Arkansas at 62 mg/L. New Jersey measures harder than 34% of states. Browse the full ranking on the statistics page.
More: hardness scale · check your address · national statistics · the national map.
By Marko Visic, MPharm, BSc Physics. Source: USGS/EPA Water Quality Portal — 44,400 New Jersey measurements. Data last verified . Methodology.
Cite this page: “New Jersey Water Hardness by County.” Hard Water Map. Retrieved 2026-07-22, https://hardwatermap.com/water-hardness/new-jersey/