Illinois Water Hardness by County
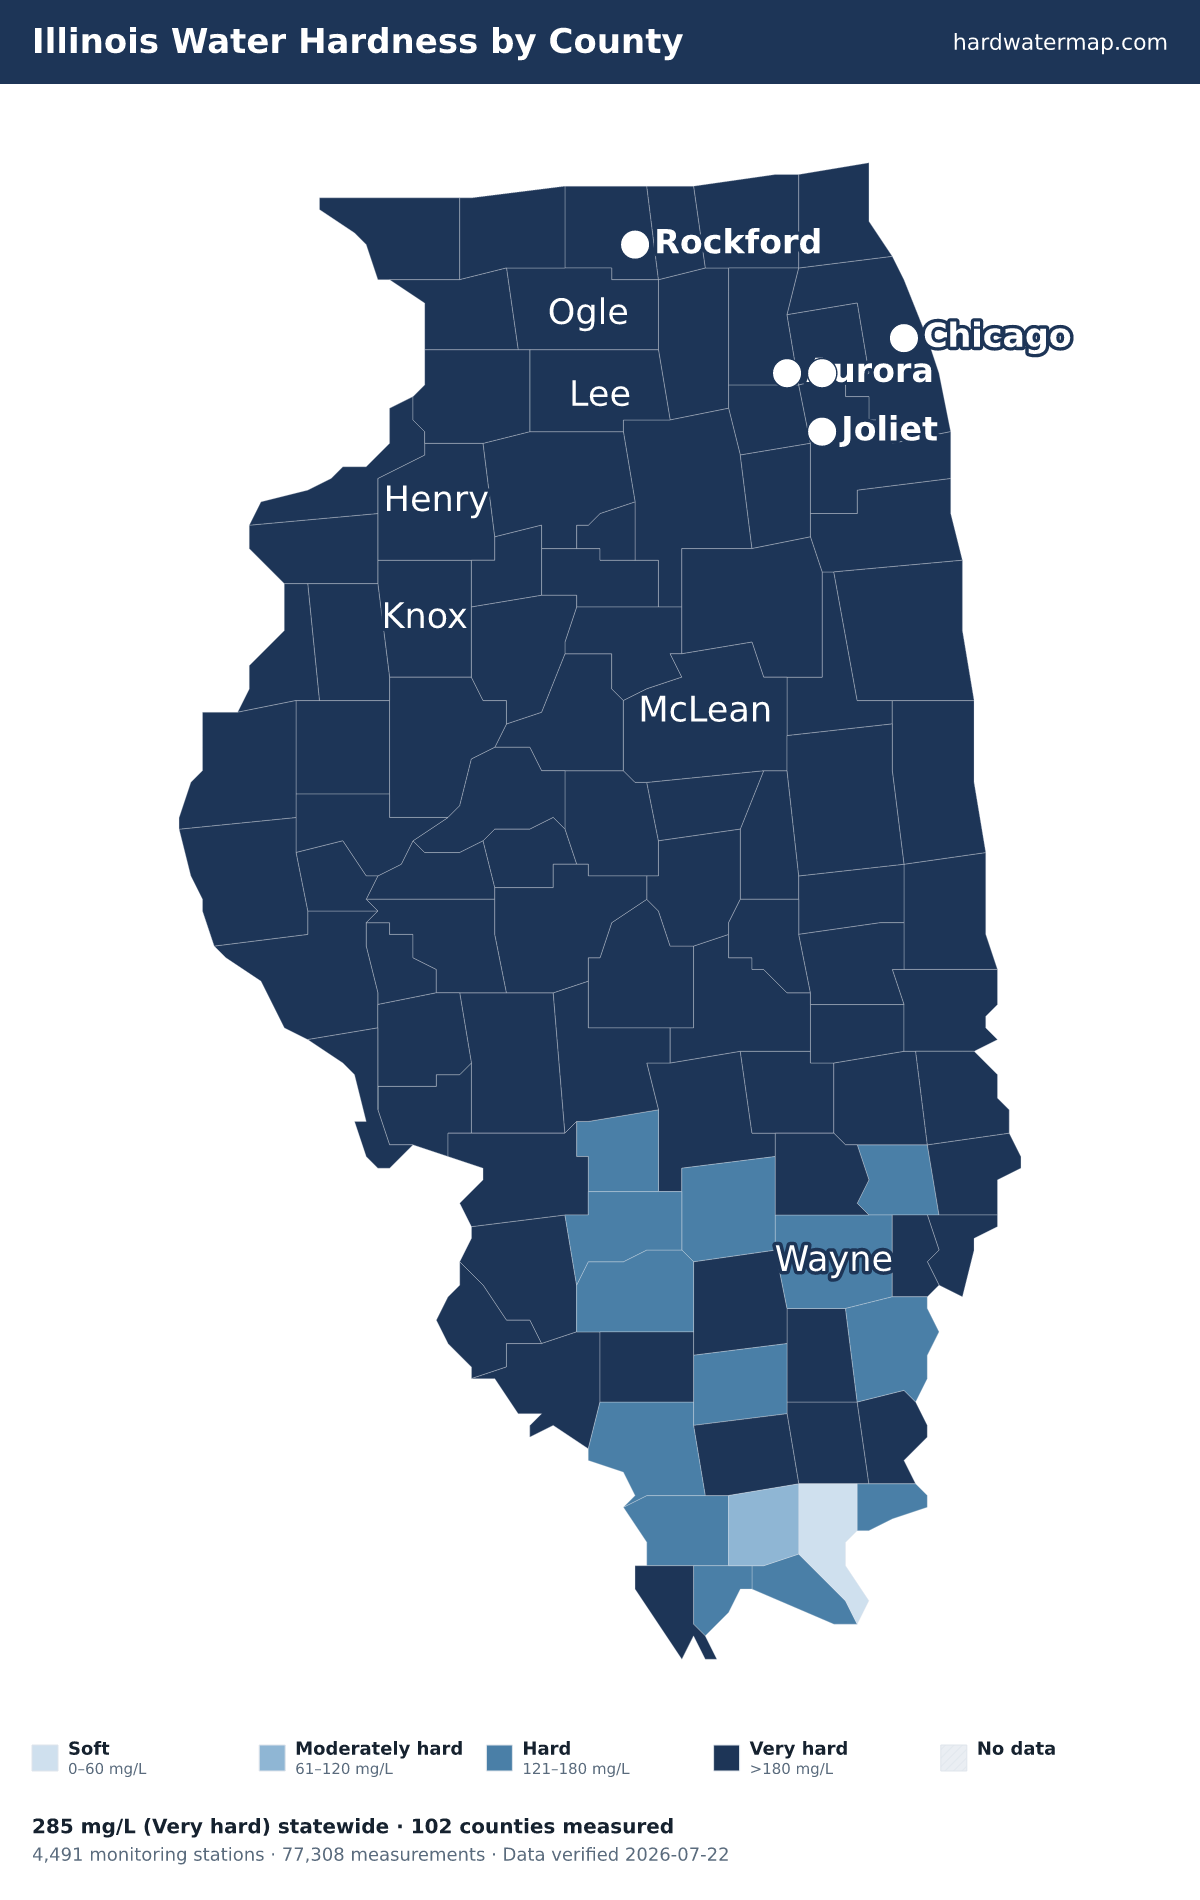
Water in Illinois has a median hardness of 285 mg/L as CaCO₃ — "very hard" on the USGS scale — based on 77,308 measurements at 4,491 monitoring stations. Saline County has the state's hardest measured water (449 mg/L); Pope County the softest (51). Rank: #5 of the 50 states and D.C.
Illinois water hardness map — what the numbers mean. Data verified 2026-07-22.
Of Illinois's 102 measured counties, 87 very hard, 13 hard, 1 moderately hard, and 1 soft. The hardest are Saline County (449 mg/L), Fulton County (390), and Kendall County (388.5). Pope County is the softest at 51 mg/L (soft).
About 100% of Illinois's roughly 12.7 million residents in counties with gate-passing hardness data live where tap water is hard or worse.
Statewide, Illinois's median works out to 16.6 grains per gallon and ranks #5 of the 50 states and D.C. Across 77,308 measurements at 4,491 stations — 42,890 of them since 2000 — the middle 80% of readings fall between 130 and 400 mg/L. The public record runs from 1901 to 2023.
See where Illinois sits nationally on the national map, or what its number means on the hardness scale.
Download the Illinois water hardness map (PNG) — Water hardness by county in Illinois: 102 counties mapped from USGS/EPA data, statewide median 285 mg/L (very hard); darker counties have harder water.
By county
Water hardness by county
The table lists all 102 measured Illinois counties, hardest first. Their medians span 449 mg/L in Saline County to 51 in Pope County — a 8.8× range.
| County | Median | Band | Results | Sites | Newest |
|---|---|---|---|---|---|
| Saline County | 449 | Very hard | 1,210 | 50 | 2022 |
| Fulton County | 390 | Very hard | 1,639 | 119 | 2022 |
| Kendall County | 388.5 | Very hard | 384 | 24 | 2022 |
| Boone County | 377 | Very hard | 409 | 40 | 2022 |
| Henry County | 377 | Very hard | 404 | 23 | 2022 |
| Jo Daviess County | 370 | Very hard | 748 | 36 | 2022 |
| Cass County | 368 | Very hard | 224 | 11 | 2018 |
| Stark County | 364 | Very hard | 637 | 20 | 2022 |
| Carroll County | 360 | Very hard | 187 | 7 | 2017 |
| Lee County | 357 | Very hard | 75 | 17 | 2019 |
| Ford County | 355 | Very hard | 42 | 5 | 2021 |
| Stephenson County | 351 | Very hard | 601 | 32 | 2022 |
| DeKalb County | 350 | Very hard | 306 | 30 | 2022 |
| Logan County | 350 | Very hard | 955 | 27 | 2022 |
| Winnebago County | 350 | Very hard | 1,356 | 65 | 2022 |
| Whiteside County | 349 | Very hard | 1,030 | 22 | 2022 |
| Knox County | 343 | Very hard | 409 | 47 | 2020 |
| Livingston County | 342 | Very hard | 565 | 57 | 2022 |
| Woodford County | 342 | Very hard | 126 | 23 | 2020 |
| Tazewell County | 341 | Very hard | 1,003 | 35 | 2022 |
| Bureau County | 340 | Very hard | 887 | 123 | 2022 |
| McHenry County | 340 | Very hard | 1,609 | 146 | 2022 |
| Moultrie County | 340 | Very hard | 817 | 12 | 2022 |
| Ogle County | 340 | Very hard | 876 | 87 | 2022 |
| Grundy County | 338 | Very hard | 769 | 26 | 2023 |
| McLean County | 329.5 | Very hard | 328 | 63 | 2020 |
| Iroquois County | 320 | Very hard | 909 | 55 | 2022 |
| LaSalle County | 319 | Very hard | 1,747 | 57 | 2022 |
| Henderson County | 318 | Very hard | 355 | 14 | 2022 |
| Kankakee County | 314 | Very hard | 908 | 36 | 2022 |
| Piatt County | 313 | Very hard | 482 | 26 | 2023 |
| Vermilion County | 313 | Very hard | 2,002 | 87 | 2022 |
| Kane County | 311 | Very hard | 1,019 | 101 | 2022 |
| Rock Island County | 311 | Very hard | 489 | 14 | 2022 |
| Mason County | 310 | Very hard | 938 | 16 | 2023 |
| Menard County | 310 | Very hard | 362 | 13 | 2018 |
| Peoria County | 310 | Very hard | 950 | 30 | 2022 |
| Champaign County | 307 | Very hard | 1,133 | 83 | 2022 |
| Coles County | 303.5 | Very hard | 548 | 29 | 2022 |
| De Witt County | 302.5 | Very hard | 670 | 35 | 2022 |
| Warren County | 300 | Very hard | 194 | 48 | 2020 |
| Will County | 293 | Very hard | 2,740 | 146 | 2022 |
| Cumberland County | 290 | Very hard | 455 | 12 | 2022 |
| Douglas County | 290 | Very hard | 698 | 21 | 2022 |
| DuPage County | 290 | Very hard | 1,618 | 117 | 2022 |
| Lake County | 290 | Very hard | 2,753 | 274 | 2023 |
| Mercer County | 290 | Very hard | 336 | 13 | 2022 |
| St. Clair County | 289 | Very hard | 1,106 | 120 | 2022 |
| Putnam County | 287 | Very hard | 277 | 8 | 2022 |
| Schuyler County | 286 | Very hard | 467 | 21 | 2022 |
| Gallatin County | 284 | Very hard | 527 | 25 | 2022 |
| Marshall County | 284 | Very hard | 280 | 12 | 2022 |
| Scott County | 283.5 | Very hard | 956 | 15 | 2022 |
| Sangamon County | 282.5 | Very hard | 1,414 | 45 | 2022 |
| Calhoun County | 280 | Very hard | 317 | 4 | 2022 |
| Edgar County | 277.5 | Very hard | 254 | 16 | 2021 |
| Madison County | 273 | Very hard | 2,106 | 114 | 2023 |
| Greene County | 272 | Very hard | 582 | 21 | 2022 |
| Clark County | 270 | Very hard | 51 | 6 | 2021 |
| Crawford County | 270 | Very hard | 1,120 | 31 | 2022 |
| Macon County | 270 | Very hard | 864 | 35 | 2022 |
| Brown County | 260 | Very hard | 159 | 6 | 2021 |
| Cook County | 260 | Very hard | 4,704 | 592 | 2022 |
| Christian County | 258 | Very hard | 955 | 38 | 2022 |
| Jasper County | 258 | Very hard | 428 | 13 | 2022 |
| Wabash County | 256 | Very hard | 14 | 4 | 2021 |
| Perry County | 254 | Very hard | 162 | 49 | 2021 |
| McDonough County | 248 | Very hard | 604 | 49 | 2022 |
| Fayette County | 246 | Very hard | 1,272 | 23 | 2022 |
| Effingham County | 239 | Very hard | 430 | 29 | 2022 |
| Monroe County | 236 | Very hard | 137 | 18 | 2022 |
| Pike County | 234 | Very hard | 777 | 30 | 2023 |
| Lawrence County | 231 | Very hard | 357 | 13 | 2022 |
| Shelby County | 228 | Very hard | 942 | 23 | 2022 |
| Adams County | 223 | Very hard | 473 | 15 | 2023 |
| Hancock County | 223 | Very hard | 174 | 14 | 2022 |
| Hamilton County | 221 | Very hard | 50 | 15 | 2021 |
| Randolph County | 217 | Very hard | 1,149 | 85 | 2022 |
| Jersey County | 215 | Very hard | 423 | 9 | 2023 |
| Alexander County | 209 | Very hard | 891 | 23 | 2023 |
| Morgan County | 206 | Very hard | 79 | 14 | 2022 |
| Clay County | 200 | Very hard | 424 | 16 | 2022 |
| Montgomery County | 200 | Very hard | 421 | 25 | 2022 |
| Macoupin County | 190 | Very hard | 381 | 37 | 2022 |
| Jefferson County | 186 | Very hard | 1,003 | 17 | 2022 |
| Edwards County | 184 | Very hard | 510 | 8 | 2022 |
| Williamson County | 180 | Very hard | 1,059 | 63 | 2022 |
| Clinton County | 176 | Hard | 1,150 | 34 | 2022 |
| Washington County | 170 | Hard | 649 | 24 | 2022 |
| Jackson County | 167 | Hard | 1,866 | 54 | 2022 |
| Bond County | 166 | Hard | 73 | 10 | 2022 |
| Union County | 166 | Hard | 187 | 52 | 2019 |
| White County | 165.5 | Hard | 702 | 16 | 2022 |
| Marion County | 160 | Hard | 985 | 33 | 2022 |
| Hardin County | 159 | Hard | 42 | 11 | 2020 |
| Wayne County | 157 | Hard | 748 | 27 | 2022 |
| Richland County | 146 | Hard | 456 | 17 | 2022 |
| Pulaski County | 126 | Hard | 1,169 | 32 | 2023 |
| Massac County | 123 | Hard | 55 | 17 | 2020 |
| Franklin County | 120 | Hard | 1,044 | 38 | 2022 |
| Johnson County | 89.7 | Moderately hard | 437 | 31 | 2022 |
| Pope County | 51 | Soft | 544 | 20 | 2022 |
ZIP codes
ZIP codes in Illinois
The ZIP codes below are grouped by the Illinois county each mostly falls within (by land area). Each ZIP takes that county's measured median — shown in the group header — so this is a ZIP-to-county guide, not a separate reading for every ZIP. To check the water system serving a specific address, use the lookup.
Key: a † after a ZIP means it has no mapped community water system — usually a private-well area. Plain ZIPs are served by a mapped community water system.
Saline County · 449 mg/L · Very hard
62917†62930†62935†62946†6296562977†
Fulton County · 390 mg/L · Very hard
61415†6142761431†61432†61433†61441†61459†61477†61482†61484†61501†6151961520†61524†61531†61542†61543†61544†61553†61563
Kendall County · 388.5 mg/L · Very hard
60447†60512†60536†6053860541†6054360545†60560
Boone County · 377 mg/L · Very hard
6100861011†61012†61038†61065†
Henry County · 377 mg/L · Very hard
6123361234†61235†61238†612416125461258†61262†61273†61274†61413†614196143461443†61468†61490†
Jo Daviess County · 370 mg/L · Very hard
61001†61025†61028†61036†61041†61059†61075†61085†61087†
Cass County · 368 mg/L · Very hard
62611†62612†62618†62622†62627†62691†
Stark County · 364 mg/L · Very hard
61421†61426†61449†61483†61491†
Carroll County · 360 mg/L · Very hard
61014†61046†61051†61053†61074†61078†61285†
Lee County · 357 mg/L · Very hard
60530†60553†61006†61021†61031†61042†61057†61310†61318†61324†61331†61353†61367†61378†
Ford County · 355 mg/L · Very hard
60919†6093360936†60946†60952†60957†60959†60962†61773†
Stephenson County · 351 mg/L · Very hard
6101361018†61019†61027†6103261039†61044†61048†61050†61060†61062†61067†6107061089†
DeKalb County · 350 mg/L · Very hard
60111†601126011560135†60145†60146†60150†60178†60520†6054860550†60552†60556
Logan County · 350 mg/L · Very hard
61723†61751†62512†62518†62519†62541†62543†62548†62634†62635†62643†6265662666†62671†
Winnebago County · 350 mg/L · Very hard
61016†61024†61063†61072†61073†61077†61079†61080†61088†61101†61102†611036110461107611086110961111611126111461115
Whiteside County · 349 mg/L · Very hard
61037†61071†61081†61230†61243†61250†61251†61252†61261†61270†61277†61283†
Knox County · 343 mg/L · Very hard
614016140261410†61414†61428†6143061436†61439†61448†61458†61467†61472†61474†61485†61488†61489†61572†
Livingston County · 342 mg/L · Very hard
6042060460†60920†60921†60929†60934†61311†61313†61319†61333†61739†61740†61741†61743†6176461769†61775†
Woodford County · 342 mg/L · Very hard
61516†6153061545†61548†61561†61570†61725†61729†61738†61742†61760†61771†
Tazewell County · 341 mg/L · Very hard
61534†61535†61546†615506155461564†61568†61571616106161161721†617336173461747†61755†61759†
Bureau County · 340 mg/L · Very hard
61312†61314†61315†61317†6132061322†6132361328†61329†61330†61337†61338†61344†61345†61346†61349†61356†6135961361†61362†61368†61374†61376†61379†
McHenry County · 340 mg/L · Very hard
60012†6001360014600216003360034†6005060051†6007160072†60081†60097†600986010260142†60152†6015660180†
Moultrie County · 340 mg/L · Very hard
61911†61914†61928†61937†61951†
Ogle County · 340 mg/L · Very hard
6011360129†61007†6101061015†61020†61030†61043†61047†61049†61052†61054†61061†610646106861084†61091†
Grundy County · 338 mg/L · Very hard
60407†6041660424†60437†60444†6045060474†60479†
McLean County · 329.5 mg/L · Very hard
61701617046170561720†61722†61724†61726†61728†61730†61731†61732†61736†61737†617446174561748†6175261753†61754†6176161770†61772†61774†61776†
Iroquois County · 320 mg/L · Very hard
60911†60912†60918†60924†60926†60927†60928†60930†60931†6093860939†60945†60948†60951†6095360955†6095660966†60967†60968†60970†60973†60974†
LaSalle County · 319 mg/L · Very hard
60470†60518†60531†60537†60549†60551†60557†61301†61316†61321†61325†6133261334†61341†61342†61348†61350†6135461358†61360†61364†61370†613716137261373†61377†
Henderson County · 318 mg/L · Very hard
61418†61425†61437†61454†61460†61469†6147161480†
Kankakee County · 314 mg/L · Very hard
60901†60910†6091360914†6091560917†60922†60935†60940†60941†60950†60954†60958†60961†60964†60969†
Piatt County · 313 mg/L · Very hard
61813†61818†6183061839†61854†61855†6185661884†61913†61929†61936†
Vermilion County · 313 mg/L · Very hard
609326094260960†60963†61810†61811†61812†61814†61817†61831†618326183361834†61841†61844†61846†61848†6185061857†61858†6186561870†61876†61883
Kane County · 311 mg/L · Very hard
60109†60110†6011860119†6012360124†6013460136†60140†60144†60151†60174601756017760183†60505605066051060511†60539†6054260554†
Rock Island County · 311 mg/L · Very hard
6120161232†61236†61237†6123961240†61242†6124461256†61257†61259†612646126561275†61278†6128261284
Mason County · 310 mg/L · Very hard
61532†61567†62617†62633†6264462655†62664†62682†
Menard County · 310 mg/L · Very hard
62613†62642†6267362675†62688†
Peoria County · 310 mg/L · Very hard
61451†61517†61523†61525†61526†61528†61529†615336153661539†61547†6155261559†6156261569616026160361604†61605616066160761614616156161661625
Champaign County · 307 mg/L · Very hard
60949†6180161802†6181561816†618206182161822†61840†61843†61845†61847†61849†61851†61852†61853†61859†61862†61863†61864†6186661871†61872†61873†6187461875†61877†61878†61880†
Coles County · 303.5 mg/L · Very hard
61912†61920†61931†619386194362440†
De Witt County · 302.5 mg/L · Very hard
6172761735†61749†61750†61777†61778†61842†61882†
Warren County · 300 mg/L · Very hard
61417†61423†61435†61447†61453†6146261473†61478†
Will County · 293 mg/L · Very hard
6040160403†604046040860410†60417†60421†604236043160432†60433†6043560436†604406044160442†604466044860449†6045160468†60481†60484†60490604916050360544605646058560586
Cumberland County · 290 mg/L · Very hard
62428†62436624476246862469
Douglas County · 290 mg/L · Very hard
61910†61919†61930†61941†61942†6195361956†
DuPage County · 290 mg/L · Very hard
6010160103601066010860126601336013760139601436014860157†601726018160184†601856018760188601896019060191605026050460514605156051660517605196052160523†6052760532605406055560559605616056360565
Lake County · 290 mg/L · Very hard
6000260015†6002060030600316003560040600416004260044†600456004660047†60048†60060†6006160064600696007360075†60083†60084600856008760088600896009660099
Mercer County · 290 mg/L · Very hard
61231†61260†61263†61272†61276†61279†61281†61412†61442†61465†61466†61476†61486†
St. Clair County · 289 mg/L · Very hard
62059†6220162203622046220562206622076220862220†62221†6222362225†622266223262239†62240622436225462255†62257†62258†6226062264†622696228262285†62289
Putnam County · 287 mg/L · Very hard
61326†61327†61335†61336†6134061363†61560†
Schuyler County · 286 mg/L · Very hard
61452†62319†62344†62624†62639†62681†
Gallatin County · 284 mg/L · Very hard
62871†62934†62954†62979†62984†
Marshall County · 284 mg/L · Very hard
61369†61375†61424†61479†61537†61540†6154161565†
Scott County · 283.5 mg/L · Very hard
62610†62621†62663†62694†
Sangamon County · 282.5 mg/L · Very hard
62515†62520†6253062536†62539†62545†62558†62561†62563†6261562625†6262962661†62670†62677†62684†62689†62693†6270162702627036270462706627076271162712†
Calhoun County · 280 mg/L · Very hard
62006†62013†62036†62045†62047†62053†
Edgar County · 277.5 mg/L · Very hard
61917†61924†6193261933†619406194461949†61955
Madison County · 273 mg/L · Very hard
62001†62002†620106201862021†62024†62025†620266203462035†620406204662048†6205862060620616206262067†62074†6208462087†620906209562097†622346224962281†62294
Greene County · 272 mg/L · Very hard
6201662027†62044†62050†62054†6207862081†62082†62092†62098†
Clark County · 270 mg/L · Very hard
62420†62423†6244162442†62474†62477†62478†
Crawford County · 270 mg/L · Very hard
6241362427†62433†6244962451†62454†62464†
Macon County · 270 mg/L · Very hard
6175661925†62501†62514†62521†62522†6252362526†62532†6253562537†62544†6254962551†62554†62573†
Brown County · 260 mg/L · Very hard
6235362375†62378†
Cook County · 260 mg/L · Very hard
600046000560007†6000860010†6001660018600226002560026600296004360053†6005660062600676006860070600746007660077600906009160093†601046010760120601306013160141†6015360154601556016060162601636016460165†6016960171†601736017660192601936019460195602016020260203602086030160302603046030560402604066040960411†60415604186041960422604256042660428604296043060438604396044360445604526045360455604566045760458†6045960461604626046360464604656046660467604696047160472604736047560476†604776047860480†604826048760501†605136052560526†6053460546605586060160602606036060460605606066060760608606096061060611606126061360614606156061660617606186061960620606216062260623606246062560626606286062960630606316063260633606346063660637606386063960640606416064260643606446064560646606476064960651606526065360654606556065660657606596066060661607066070760712607146080360804†6080560827
Christian County · 258 mg/L · Very hard
6208362510†62513†62517†62531†6254062546†62547†6255562556†6255762567†6256862570†
Jasper County · 258 mg/L · Very hard
62432624456244862459624756247962480†62481
Wabash County · 256 mg/L · Very hard
62410†62811†6285262863†
Perry County · 254 mg/L · Very hard
62237†62238†62274628326288862997
McDonough County · 248 mg/L · Very hard
61411†614166142061422†61438†61440†61455†61470†61475†62326†
Fayette County · 246 mg/L · Very hard
620116208062414†62418†6245862471†62838†6288062885†
Effingham County · 239 mg/L · Very hard
62401624116242462443624616246762473
Monroe County · 236 mg/L · Very hard
62236†62244†62248622566227862279†62295†62298†
Pike County · 234 mg/L · Very hard
62312†62314†62323†62340†62343†62345†62352†62355†62356†62357†62361†62362†62363†62366†62370†
Lawrence County · 231 mg/L · Very hard
62417†62439†62460†62466†
Shelby County · 228 mg/L · Very hard
6195762422†62431†624386244462462624636246562534†62550†625536256562571
Adams County · 223 mg/L · Very hard
623016230562320†62324†62325†62338†62339†62346†62347†62348†62349†62351†62359†62360†62365†62376†
Hancock County · 223 mg/L · Very hard
61450†62311†62313†62316†62321†62330†6233462336†62341†62354†62358†62367†62373†62374†62379†62380†
Hamilton County · 221 mg/L · Very hard
6281762828†6282962859
Randolph County · 217 mg/L · Very hard
62217†62233†62241†62242†62261†62272†62277†6228662288†6229262297†
Jersey County · 215 mg/L · Very hard
62012†62022†6202862030†62031†62037†6205262063†
Alexander County · 209 mg/L · Very hard
62914†62957†62962†62969†62988†62990†
Morgan County · 206 mg/L · Very hard
62601†62628†62631†62638†6265062665†62668†62692†62695†
Clay County · 200 mg/L · Very hard
62426†6243462824†62839†628586287962899†
Montgomery County · 200 mg/L · Very hard
620156201762032620496205162056620756207662077†6208962091†6209462533†62538†62560†62572†
Macoupin County · 190 mg/L · Very hard
620096201462023†62033†62069†62079†620856208862093†6262662630†62640†62649†62667†6267262674†62685†62690
Jefferson County · 186 mg/L · Very hard
62810†62814†62816†62830†62846†6286462872†62883†62889†62893†6289462898†
Edwards County · 184 mg/L · Very hard
6247662806†6281562818†
Williamson County · 180 mg/L · Very hard
62841†62902†6291562918†62921†62922†6293362948629496295162959†62974†
Clinton County · 176 mg/L · Hard
62215†62216†62218†6221962230†62231†62245†6225062265†62266†62293†
Washington County · 170 mg/L · Hard
62214†62263†62268†62271†62803†62808†62831†6284862876†62877†
Jackson County · 167 mg/L · Hard
62280†6290162903†62907†62916†62924†62927†62932†62940†62942†62950†62958†6296662975†62994†
Bond County · 166 mg/L · Hard
62019†62086†62246†62253†62262†62273†62275†62284†
Union County · 166 mg/L · Hard
62905†62906†62920†62926†62952†62961†62998†
White County · 165.5 mg/L · Hard
62820†62821†62827†62835†62844†62861†62862†62867†62869†62887†
Marion County · 160 mg/L · Hard
6280162807†62849†62853†62854†62870†62875†6288162882†62892†
Hardin County · 159 mg/L · Hard
62919†62931†62982†
Wayne County · 157 mg/L · Hard
62446†62809†6282362833†62837†62842†62843†62850†62851†62878†62886†62895†
Richland County · 146 mg/L · Hard
6241962421†62425624506245262868
Pulaski County · 126 mg/L · Hard
62941†62963†62964†62970†62976†62992†62996†
Massac County · 123 mg/L · Hard
62908†62910†6295362956†62960†
Franklin County · 120 mg/L · Hard
6281262819†6282262825†62836†6285662860†62865†6287462884†62890†628916289662897†62983†62999†
Johnson County · 89.7 mg/L · Moderately hard
62912†62923†6293962943†62967†62972†62995
Pope County · 51 mg/L · Soft
62928†62938†62947†62985†62987†
† 871 ZIP codes are not served by a mapped community water system — most are private-well areas. See well water hardness.
Source
Groundwater vs surface water
Illinois's groundwater measures harder than its surface water — 307 mg/L across 3,461 samples versus 284 across 73,634, about 1.1× harder. Wells draw from groundwater, so well owners in Illinois tend to see the harder number — 307 mg/L, very hard. Groundwater readings there run 8 to 680.6 mg/L across the middle 80% of samples. The comparison draws on 1,344 groundwater and 3,044 surface-water monitoring sites; 137 readings above 2,000 mg/L were logged but held out of the medians as outliers.
Groundwater (wells)
307 mg/L as CaCO₃ · 3,461 results at 1,344 stations.
Surface water (rivers, lakes)
284 mg/L as CaCO₃ · 73,634 results at 3,044 stations.
Groundwater measures about 1.1× harder than surface water here.
Chemistry
Water chemistry in Illinois
Beyond the hardness number, Illinois's water carries a fuller chemical signature — here is how its measured parameters compare to national benchmarks.
TDS
249 mg/L · n=5,443
249 mg/L — about 1.1× the national county median of 226, consistent with hard, mineral-rich water.
pH
7.8 pH · n=19,948
pH 7.8 — within the EPA secondary range of 6.5–8.5, on the alkaline side.
Alkalinity
182 mg/L as CaCO3 · n=34,451
182 mg/L — substantial buffering capacity, which resists pH swings.
Calcium : Magnesium
63.5 : 27.6 mg/L ≈ 2.3 : 1 · n=81,024
Calcium is about 58% of Illinois's hardness (63.5 mg/L Ca to 27.6 mg/L Mg), a little more magnesium-rich than the national ~68% calcium share.
Parameter medians may include a small share of quality-control samples; the hardness lane is fully QC-filtered.
Aquifers
Major aquifers under Illinois
3 aquifer systems supply much of Illinois's measured groundwater.
- Silurian-Devonian aquifers — median 365 mg/L across 99 samples at 38 sites: very hard.
- Sand and gravel aquifers (glaciated regions) — median 355 mg/L across 1,088 samples at 479 sites: very hard.
- Mississippian aquifers — median 235 mg/L across 16 samples at 6 sites: very hard.
Together these systems account for 1,203 measured samples at 523 sites. Aquifer medians pool samples across a whole system and can mask local variation — see the national aquifer map for how these compare across states.
Trend
Hardness over time
Illinois's decade median moved from 418 mg/L in the 1910s to 262 in the 2020s. Over the series, the decade median peaked at 418 mg/L in the 1910s and bottomed at 140 in the 1950s. Decade medians reflect where and what agencies sampled in each era, not just changes in the water itself.
Scale
Where Illinois sits on the scale
On the USGS scale, Illinois's 285 mg/L is very hard — 16.6 grains per gallon, well above the 180 mg/L very-hard cutoff — among the hardest water measured in the US.
At 285 mg/L (16.6 gpg), water-softener owners in Illinois typically set their unit to this hardness — settings calculator.
Questions
Frequently asked questions
- Is Illinois's water hard?
- Illinois's median hardness is 285 mg/L as CaCO₃, "very hard" on the USGS scale and 2.04× the national county median of 140 mg/L. About 100% of residents in measured counties have hard-or-worse water.
- Which county in Illinois has the hardest water?
- Saline County, with a median of 449 mg/L as CaCO₃ across 1,210 measurements.
- Is well water harder than city water in Illinois?
- Groundwater measures harder here — about 1.1× the surface water — so wells tend to run harder (groundwater 307 vs surface water 284 mg/L).
- How do I find my exact hardness in Illinois?
- Search your ZIP on the lookup tool, read your utility's Consumer Confidence Report, or test at home with a kit.
- Is Illinois's water harder than the national average?
- Yes. Illinois's median of 285 mg/L is 2.04× the national county median of 140 mg/L, and Illinois ranks #5 of the 50 states and D.C.
Compare
States with similar hardness
Two states measure closest to Illinois's 285 mg/L: Indiana at 280 mg/L and Arizona at 300 mg/L. Illinois measures harder than 92% of states. Browse the full ranking on the statistics page.
More: hardness scale · check your address · national statistics · the national map.
By Marko Visic, MPharm, BSc Physics. Source: USGS/EPA Water Quality Portal — 77,308 Illinois measurements. Data last verified . Methodology.
Cite this page: “Illinois Water Hardness by County.” Hard Water Map. Retrieved 2026-07-22, https://hardwatermap.com/water-hardness/illinois/