Indiana Water Hardness by County
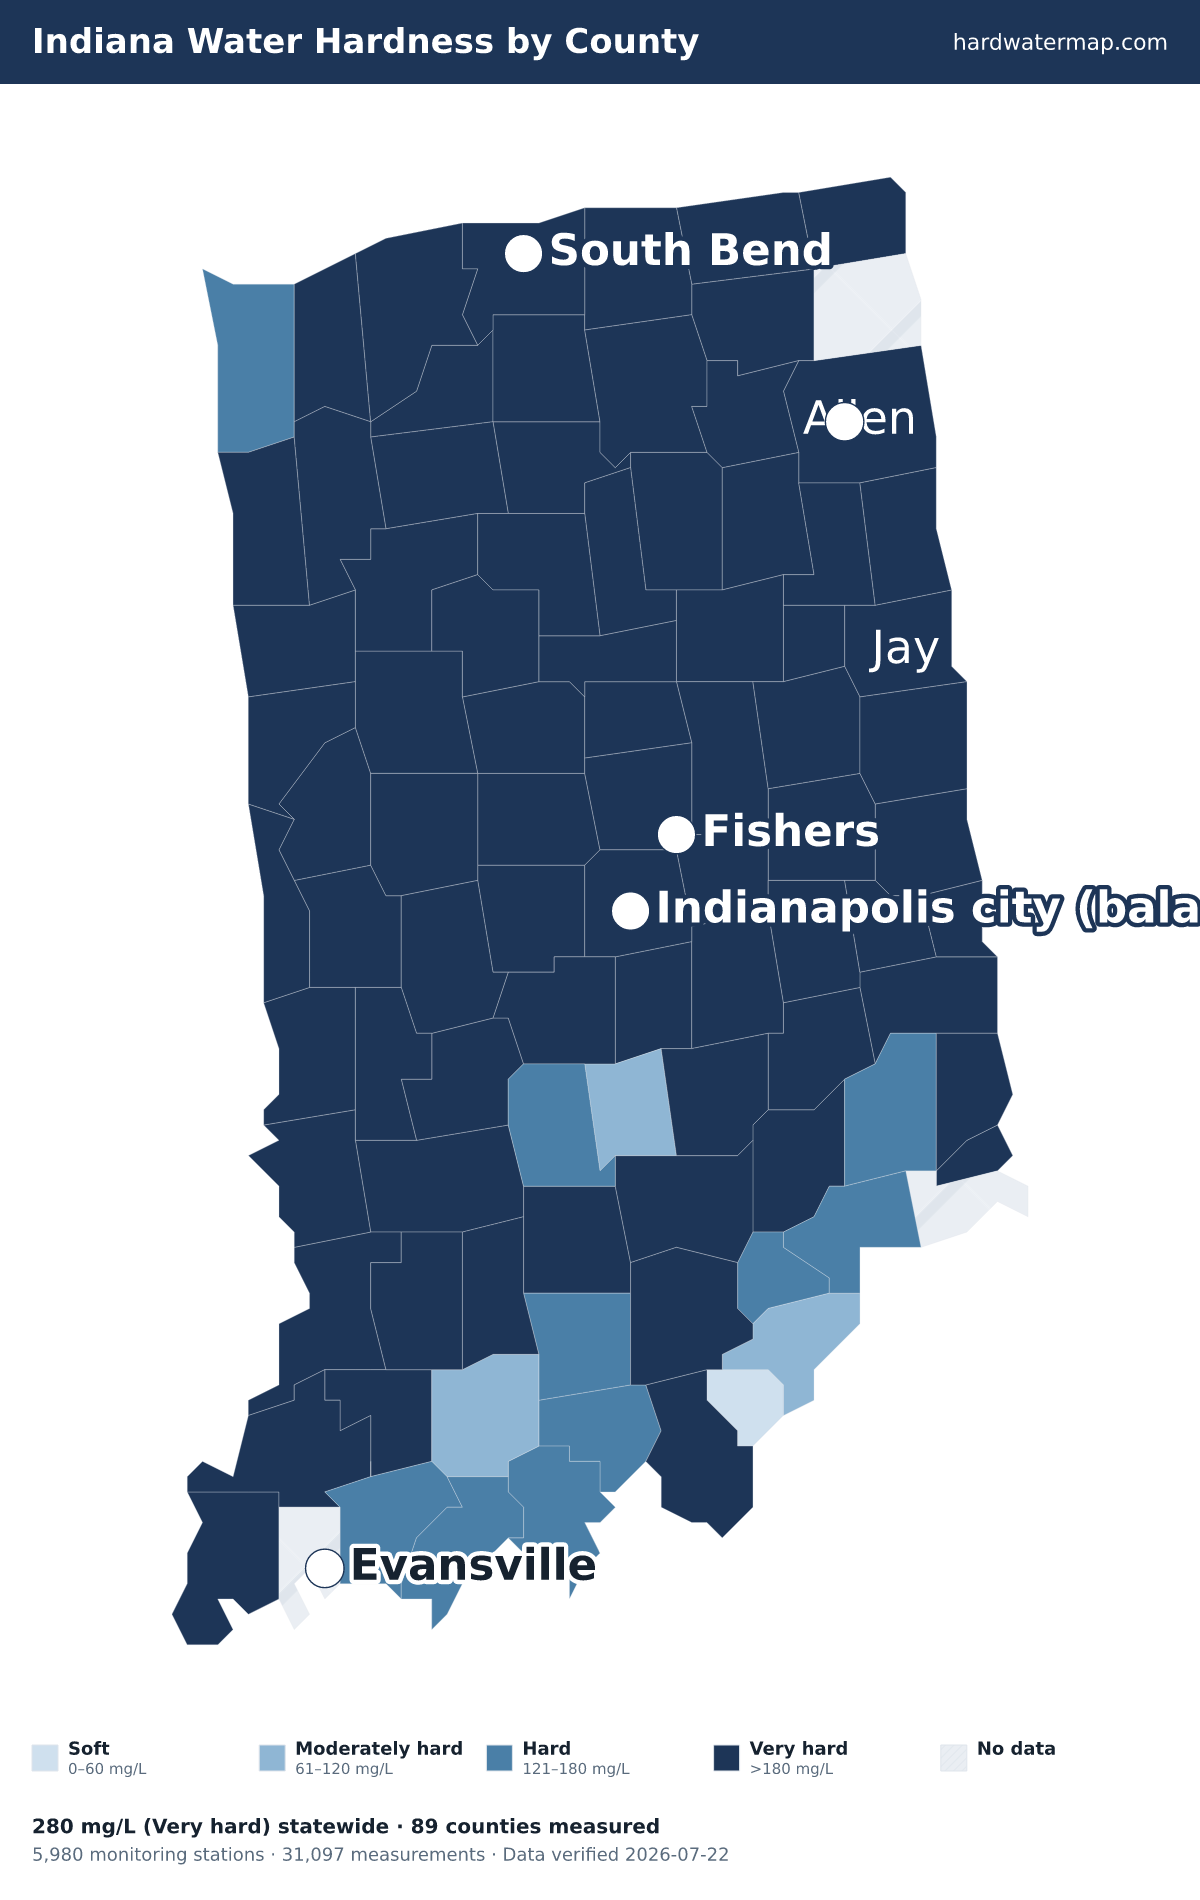
Water in Indiana has a median hardness of 280 mg/L as CaCO₃ — "very hard" on the USGS scale — based on 31,097 measurements at 5,980 monitoring stations. Henry County has the state's hardest measured water (374 mg/L); Floyd County the softest (1.8). Rank: #6 of the 50 states and D.C.
Indiana water hardness map — what the numbers mean. Data verified 2026-07-22.
Of Indiana's 89 measured counties, 75 very hard, 10 hard, 3 moderately hard, and 1 soft. The hardest are Henry County (374 mg/L), Blackford County (373), and Jay County (367). Floyd County is the softest at 1.8 mg/L (soft).
About 96% of Indiana's roughly 6.6 million residents in counties with gate-passing hardness data live where tap water is hard or worse.
Statewide, Indiana's median works out to 16.4 grains per gallon and ranks #6 of the 50 states and D.C. Across 31,097 measurements at 5,980 stations — 11,285 of them since 2000 — the middle 80% of readings fall between 138 and 388 mg/L. The public record runs from 1901 to 2024.
See where Indiana sits nationally on the national map, or what its number means on the hardness scale.
Download the Indiana water hardness map (PNG) — Water hardness by county in Indiana: 89 counties mapped from USGS/EPA data, statewide median 280 mg/L (very hard); darker counties have harder water.
By county
Water hardness by county
The table lists all 89 measured Indiana counties, hardest first. Their medians span 374 mg/L in Henry County to 1.8 in Floyd County — a 207.8× range. 3 more Indiana counties lack gate-passing data.
| County | Median | Band | Results | Sites | Newest |
|---|---|---|---|---|---|
| Henry County | 374 | Very hard | 155 | 23 | 2014 |
| Blackford County | 373 | Very hard | 88 | 15 | 2013 |
| Jay County | 367 | Very hard | 229 | 7 | 2022 |
| Whitley County | 358.5 | Very hard | 74 | 6 | 2004 |
| Clinton County | 348.5 | Very hard | 234 | 64 | 2004 |
| Madison County | 342 | Very hard | 372 | 40 | 2014 |
| Marshall County | 340 | Very hard | 46 | 18 | 2004 |
| Wayne County | 336 | Very hard | 313 | 52 | 2020 |
| Steuben County | 333 | Very hard | 90 | 26 | 2005 |
| Fayette County | 332 | Very hard | 143 | 16 | 2004 |
| Benton County | 331 | Very hard | 29 | 15 | 2004 |
| Rush County | 331 | Very hard | 133 | 15 | 2014 |
| LaGrange County | 330 | Very hard | 19 | 16 | 2000 |
| Randolph County | 330 | Very hard | 392 | 37 | 2014 |
| Wells County | 329.5 | Very hard | 10 | 4 | 2003 |
| Warren County | 327 | Very hard | 190 | 15 | 2004 |
| Adams County | 326 | Very hard | 502 | 53 | 2004 |
| Delaware County | 325.5 | Very hard | 512 | 114 | 2014 |
| Hamilton County | 325 | Very hard | 147 | 32 | 2014 |
| Boone County | 320 | Very hard | 79 | 20 | 2014 |
| Grant County | 319.5 | Very hard | 352 | 26 | 2004 |
| Montgomery County | 318.5 | Very hard | 372 | 69 | 2004 |
| Johnson County | 316 | Very hard | 367 | 20 | 2004 |
| Shelby County | 310 | Very hard | 137 | 23 | 2014 |
| Tipton County | 310 | Very hard | 50 | 39 | 2004 |
| Vermillion County | 310 | Very hard | 581 | 29 | 2022 |
| Fountain County | 309 | Very hard | 297 | 225 | 2004 |
| Union County | 309 | Very hard | 15 | 10 | 2002 |
| White County | 309 | Very hard | 79 | 12 | 2004 |
| Marion County | 307.5 | Very hard | 1,908 | 310 | 2014 |
| Newton County | 306 | Very hard | 308 | 53 | 2021 |
| Cass County | 305.5 | Very hard | 430 | 49 | 2023 |
| Noble County | 305 | Very hard | 26 | 22 | 2003 |
| Carroll County | 304 | Very hard | 336 | 26 | 2004 |
| Morgan County | 303 | Very hard | 449 | 51 | 2014 |
| Fulton County | 300 | Very hard | 455 | 291 | 2004 |
| Hendricks County | 300 | Very hard | 205 | 32 | 2021 |
| Jasper County | 300 | Very hard | 196 | 82 | 2021 |
| Pulaski County | 300 | Very hard | 95 | 12 | 2004 |
| Tippecanoe County | 299 | Very hard | 552 | 69 | 2014 |
| Bartholomew County | 298.5 | Very hard | 298 | 46 | 2023 |
| Huntington County | 298 | Very hard | 694 | 11 | 2004 |
| Hancock County | 294 | Very hard | 755 | 60 | 2023 |
| Howard County | 293 | Very hard | 344 | 96 | 2004 |
| Allen County | 290 | Very hard | 912 | 27 | 2012 |
| Vigo County | 290 | Very hard | 401 | 276 | 2021 |
| Starke County | 289.5 | Very hard | 96 | 19 | 2004 |
| Elkhart County | 285.5 | Very hard | 710 | 130 | 2004 |
| Putnam County | 285 | Very hard | 233 | 38 | 2014 |
| Parke County | 282.5 | Very hard | 704 | 52 | 2004 |
| Decatur County | 280 | Very hard | 41 | 15 | 2023 |
| Franklin County | 280 | Very hard | 325 | 22 | 2020 |
| St. Joseph County | 280 | Very hard | 471 | 429 | 2013 |
| Sullivan County | 280 | Very hard | 641 | 163 | 2004 |
| Kosciusko County | 271 | Very hard | 298 | 61 | 2004 |
| Knox County | 270 | Very hard | 423 | 84 | 2004 |
| Wabash County | 265 | Very hard | 316 | 10 | 2004 |
| Porter County | 264 | Very hard | 2,510 | 355 | 2013 |
| Owen County | 260 | Very hard | 233 | 87 | 2004 |
| Daviess County | 252 | Very hard | 275 | 37 | 2004 |
| Miami County | 248 | Very hard | 333 | 15 | 2023 |
| LaPorte County | 240 | Very hard | 247 | 169 | 2023 |
| Pike County | 231 | Very hard | 427 | 39 | 2008 |
| Clay County | 230 | Very hard | 816 | 519 | 2004 |
| Greene County | 227.5 | Very hard | 382 | 147 | 2004 |
| Posey County | 224 | Very hard | 335 | 42 | 2023 |
| Dearborn County | 220 | Very hard | 205 | 12 | 2019 |
| Lawrence County | 214 | Very hard | 732 | 23 | 2019 |
| Gibson County | 212 | Very hard | 782 | 42 | 2023 |
| Jackson County | 200 | Very hard | 357 | 20 | 2013 |
| Ohio County | 189 | Very hard | 68 | 3 | 2004 |
| Harrison County | 188 | Very hard | 141 | 11 | 2019 |
| Martin County | 187 | Very hard | 189 | 14 | 2019 |
| Jennings County | 182 | Very hard | 261 | 25 | 2004 |
| Washington County | 180 | Very hard | 153 | 28 | 2004 |
| Ripley County | 178 | Hard | 83 | 14 | 2004 |
| Orange County | 170 | Hard | 161 | 33 | 2002 |
| Spencer County | 170 | Hard | 51 | 38 | 2019 |
| Lake County | 168 | Hard | 2,409 | 484 | 2022 |
| Jefferson County | 160 | Hard | 69 | 17 | 2019 |
| Monroe County | 160 | Hard | 37 | 13 | 2001 |
| Warrick County | 158 | Hard | 232 | 29 | 2024 |
| Crawford County | 152 | Hard | 74 | 9 | 2004 |
| Scott County | 149 | Hard | 28 | 17 | 2002 |
| Perry County | 130 | Hard | 455 | 32 | 2023 |
| Clark County | 103 | Moderately hard | 52 | 20 | 2019 |
| Dubois County | 96 | Moderately hard | 261 | 61 | 2004 |
| Brown County | 64 | Moderately hard | 29 | 9 | 2002 |
| Floyd County | 1.8 | Soft | 12 | 5 | 2019 |
ZIP codes
ZIP codes in Indiana
The ZIP codes below are grouped by the Indiana county each mostly falls within (by land area). Each ZIP takes that county's measured median — shown in the group header — so this is a ZIP-to-county guide, not a separate reading for every ZIP. To check the water system serving a specific address, use the lookup.
Key: a † after a ZIP means it has no mapped community water system — usually a private-well area. Plain ZIPs are served by a mapped community water system.
Henry County · 374 mg/L · Very hard
46148†47337†47344†47351†47352†47356†47360†473614736247366†47384†47385†47386†47387†47388†
Blackford County · 373 mg/L · Very hard
47348†47359
Jay County · 367 mg/L · Very hard
47326†47336†47369†47371†47373†47381†
Whitley County · 358.5 mg/L · Very hard
46723†4672546764†46787†
Clinton County · 348.5 mg/L · Very hard
46035†46039†46041†46050†46057†46058†46065†
Madison County · 342 mg/L · Very hard
46001†46011†46012†46013†4601646017†46036†46044†46048†4605146056†4606346064†46070†
Marshall County · 340 mg/L · Very hard
46501†4650446506†46511†46513†46537†4656346570†46572†
Wayne County · 336 mg/L · Very hard
47324†47327†47330†4733547339†47341†47345†47346†47357†47370†4737447392†47393†
Steuben County · 333 mg/L · Very hard
4670346737†46742†46747†4677646779†
Fayette County · 332 mg/L · Very hard
47331†
Benton County · 331 mg/L · Very hard
47921†47942†47944†47971†47986†
Rush County · 331 mg/L · Very hard
46104†4611546127†46133†46146†46150†46155†46156†46173†
LaGrange County · 330 mg/L · Very hard
4656546571†46746†46761†46771†46786†46789†46795†
Randolph County · 330 mg/L · Very hard
47340†47354†47355†47358†47368†47380†47382†47390†47394
Wells County · 329.5 mg/L · Very hard
4671446731†46759†46766†46770†46777†46778†46781†46791†46799†
Warren County · 327 mg/L · Very hard
47917†47970†47975†47982†47991†47993†
Adams County · 326 mg/L · Very hard
46711†467334674046772†
Delaware County · 325.5 mg/L · Very hard
47302†47303†47304†473054730647320†47334†4733847342†47367†47383†47396†
Hamilton County · 325 mg/L · Very hard
4603046031†460324603346034†460374603846060†4606246069460744628046290
Boone County · 320 mg/L · Very hard
4605246071†46075†460774610246147†
Grant County · 319.5 mg/L · Very hard
46919†46928†46930†4693346938†46952†46953†46957†46986†46987†46989†46991†
Montgomery County · 318.5 mg/L · Very hard
47916†4793347940†47954†47955†4796547967†47968†47989†47990†47994†
Johnson County · 316 mg/L · Very hard
46106†46131461424614346162†4618146184†
Shelby County · 310 mg/L · Very hard
46110†46124†4612646130†46144†46161†4617646182†47234†
Tipton County · 310 mg/L · Very hard
46045†46047†46049†46068†46072†46076†
Vermillion County · 310 mg/L · Very hard
4783147842†47847†47854†478754788447928†4796647974†
Fountain County · 309 mg/L · Very hard
47918†47932†47949†47952†47958†47969†47987†
Union County · 309 mg/L · Very hard
47003†47325†47353†
White County · 309 mg/L · Very hard
47923†47925†47926†47929†47950†47959†47960†47980†47995†
Marion County · 307.5 mg/L · Very hard
4610746183462014620246203462044620546206462084621446216†46217462184621946220462214622246224†462254622646227462284622946235462364623746239462404624146250462544625646259462604626846278
Newton County · 306 mg/L · Very hard
46349†46379†46381†47922†47943†47948†4795147963†47964†
Cass County · 305.5 mg/L · Very hard
46932†4694746950†46961†46967†46978†46988†46994†46998†
Noble County · 305 mg/L · Very hard
46701†46710†46732†4675546760†46763†46767†46784†46794†46796†
Carroll County · 304 mg/L · Very hard
46913†46915†46917†46920†46923†46929†47997†
Morgan County · 303 mg/L · Very hard
461114611346125†46151†46157†46158†46166†46180†
Fulton County · 300 mg/L · Very hard
46910†46922†46931†46939†46945†46975†
Hendricks County · 300 mg/L · Very hard
46103†4611246118†46121†46122†4612346149†46165†46167†461684623146234
Jasper County · 300 mg/L · Very hard
46310†46392†4797747978†
Pulaski County · 300 mg/L · Very hard
46960†46968†46985†46996†47946†47957†
Tippecanoe County · 299 mg/L · Very hard
479014790447905†47906†4790747909†47920†47924†47930†4794147981†47983†47992†
Bartholomew County · 298.5 mg/L · Very hard
47201†47203†47226†47232†47236†47244†4724647247†47280
Huntington County · 298 mg/L · Very hard
46702†4675046783†46792†
Hancock County · 294 mg/L · Very hard
46040†4605546117†4614046154†4616346186†
Howard County · 293 mg/L · Very hard
46901†46902†46936†46937†46965†46979†
Allen County · 290 mg/L · Very hard
46704†46741†46743†46745†46748†46765†46773†46774†4679746798†46802468034680446805468064680746808†46809†46814†4681546816†46818†46819†468254683546845†
Vigo County · 290 mg/L · Very hard
47802†478034780447805†478074780947851†47863†47866†47869†47870478714787647880†47885†
Starke County · 289.5 mg/L · Very hard
46366†46374†46531†46532†46534
Elkhart County · 285.5 mg/L · Very hard
46507465144651646517†46526†46528†4654046543†4655046553†46573†
Putnam County · 285 mg/L · Very hard
461054612046128†46135†46170†46171†46172†46175†
Parke County · 282.5 mg/L · Very hard
47832†47836†47837†47859†478604786247872†47874†
Decatur County · 280 mg/L · Very hard
47225†47240†47263†47272†47283†
Franklin County · 280 mg/L · Very hard
47010†47012†47016†47024†47030†47035†47036†
St. Joseph County · 280 mg/L · Very hard
46530†46536†46544†4654546552†46554†4655646561†46595†46601466134661446615466164661746619†46624†466284663546637†
Sullivan County · 280 mg/L · Very hard
47838†47848†47849†47850†4785547861†4786547879†47882
Kosciusko County · 271 mg/L · Very hard
46502†46508†46510†46524†46538†46539†46542†46555†46562†46567†46580†46582†46590†46982†
Knox County · 270 mg/L · Very hard
4751247516†47524†47528†47535†47557†47561†47573†47578†47591†47596†47597†
Wabash County · 265 mg/L · Very hard
46940†46941†46943†46946†46962†46974†46980†4698446990†46992
Porter County · 264 mg/L · Very hard
46301†46302†4630446341†46347†4636846383†46385†46393†
Owen County · 260 mg/L · Very hard
47427†47431†47433†47455†47456†47460†47868†
Daviess County · 252 mg/L · Very hard
4750147519†47529†47558†47562†47568†
Miami County · 248 mg/L · Very hard
46911†46914†46926†46951†46958†46959†4697046971†
LaPorte County · 240 mg/L · Very hard
46340†46345†4634646348†463504636046365†46371†46382†46390†46391†46574†
Pike County · 231 mg/L · Very hard
47564†47567†4758447585†47590†47598
Clay County · 230 mg/L · Very hard
47833†4783447840†478414784547846†478534785747858†47881
Greene County · 227.5 mg/L · Very hard
47424†474384744147443†4744547449†47453†4745747459†47465†47471†
Posey County · 224 mg/L · Very hard
4762047631†4763347638†
Dearborn County · 220 mg/L · Very hard
47001†47018†47022†47025†47032†47041†47060†
Lawrence County · 214 mg/L · Very hard
4742047421†47436†47437†474464745147462†47467†47470†
Gibson County · 212 mg/L · Very hard
47612†47616†47639†47640†47648†47649†47654†47660†47665†47666†47670†47683†
Jackson County · 200 mg/L · Very hard
4722047229†47235†47260†47264†47274†47281†
Ohio County · 189 mg/L · Very hard
47040†
Harrison County · 188 mg/L · Very hard
47110†4711247114†47115†47117†47135†47136†47142†47160†471614716447166†
Martin County · 187 mg/L · Very hard
47522†47553†47581†
Jennings County · 182 mg/L · Very hard
47223†47227†4726547270†47273†47282
Washington County · 180 mg/L · Very hard
47108†47120†47125†4716547167
Ripley County · 178 mg/L · Hard
47006†47017†47021†47023†47031†470334703447037†47042†
Orange County · 170 mg/L · Hard
47432†47452†47454†47469†
Spencer County · 170 mg/L · Hard
47531†4753747550†47552†47577†4757947588†47611†47615†47634†47635†
Lake County · 168 mg/L · Hard
46303†4630746311463124631946320463214632246323463244632746342†46356†463734637546376†46377†46394464024640346404464054640646407464084640946410
Jefferson County · 160 mg/L · Hard
47138†47224†47230†47231†47243†47250†
Monroe County · 160 mg/L · Hard
47401†4740347404474054740647408†47429474344745847464†47468†
Warrick County · 158 mg/L · Hard
47523†4760147610†47613†47619†4763047637†
Crawford County · 152 mg/L · Hard
47116†47118†47123†47137†47140†47145†47174†47175†
Scott County · 149 mg/L · Hard
4710247170†47177†
Perry County · 130 mg/L · Hard
47514†47515†47520†47525†47551†47574†47576†47586†
Clark County · 103 mg/L · Moderately hard
47104†47106†47111†47126471294713047141†4714347147†47162†47163†47172†
Dubois County · 96 mg/L · Moderately hard
47513†47521†47527†4753247541†475424754647575†47580†
Brown County · 64 mg/L · Moderately hard
46160†461644743547448†
Floyd County · 1.8 mg/L · Soft
47119†47122†47124†47150
† 562 ZIP codes are not served by a mapped community water system — most are private-well areas. See well water hardness.
Source
Groundwater vs surface water
Indiana's groundwater measures harder than its surface water — 297 mg/L across 5,734 samples versus 280 across 24,390, about 1.1× harder. Wells draw from groundwater, so well owners in Indiana tend to see the harder number — 297 mg/L, very hard. Groundwater readings there run 95.3 to 500 mg/L across the middle 80% of samples. The comparison draws on 3,671 groundwater and 2,225 surface-water monitoring sites; 116 readings above 2,000 mg/L were logged but held out of the medians as outliers.
Groundwater (wells)
297 mg/L as CaCO₃ · 5,734 results at 3,671 stations.
Surface water (rivers, lakes)
280 mg/L as CaCO₃ · 24,390 results at 2,225 stations.
Groundwater measures about 1.1× harder than surface water here.
Chemistry
Water chemistry in Indiana
Beyond the hardness number, Indiana's water carries a fuller chemical signature — here is how its measured parameters compare to national benchmarks.
TDS
294 mg/L · n=2,250
294 mg/L — about 1.3× the national county median of 226, consistent with hard, mineral-rich water.
pH
8 pH · n=2,392
pH 8 — within the EPA secondary range of 6.5–8.5, on the alkaline side.
Alkalinity
177 mg/L as CaCO3 · n=4,487
177 mg/L — substantial buffering capacity, which resists pH swings.
Calcium : Magnesium
62.1 : 21.4 mg/L ≈ 2.9 : 1 · n=3,075
Calcium is about 64% of Indiana's hardness (62.1 mg/L Ca to 21.4 mg/L Mg), a little more magnesium-rich than the national ~68% calcium share.
Parameter medians may include a small share of quality-control samples; the hardness lane is fully QC-filtered.
Aquifers
Major aquifers under Indiana
3 aquifer systems supply much of Indiana's measured groundwater.
- Alluvial aquifers — median 312.5 mg/L across 68 samples at 33 sites: very hard.
- Sand and gravel aquifers (glaciated regions) — median 310 mg/L across 2,291 samples at 1,087 sites: very hard.
- Silurian-Devonian aquifers — median 308 mg/L across 96 samples at 73 sites: very hard.
Together these systems account for 2,455 measured samples at 1,193 sites. Aquifer medians pool samples across a whole system and can mask local variation — see the national aquifer map for how these compare across states.
Trend
Hardness over time
Indiana's decade median moved from 280 mg/L in the 1950s to 246.5 in the 2020s. Over the series, the decade median peaked at 290 mg/L in the 1960s and bottomed at 243 in the 2010s. Decade medians reflect where and what agencies sampled in each era, not just changes in the water itself.
Scale
Where Indiana sits on the scale
On the USGS scale, Indiana's 280 mg/L is very hard — 16.4 grains per gallon, well above the 180 mg/L very-hard cutoff — among the hardest water measured in the US.
At 280 mg/L (16.4 gpg), water-softener owners in Indiana typically set their unit to this hardness — settings calculator.
Questions
Frequently asked questions
- Is Indiana's water hard?
- Indiana's median hardness is 280 mg/L as CaCO₃, "very hard" on the USGS scale and 2× the national county median of 140 mg/L. About 96% of residents in measured counties have hard-or-worse water.
- Which county in Indiana has the hardest water?
- Henry County, with a median of 374 mg/L as CaCO₃ across 155 measurements.
- Is well water harder than city water in Indiana?
- Groundwater measures harder here — about 1.1× the surface water — so wells tend to run harder (groundwater 297 vs surface water 280 mg/L).
- How do I find my exact hardness in Indiana?
- Search your ZIP on the lookup tool, read your utility's Consumer Confidence Report, or test at home with a kit.
- Is Indiana's water harder than the national average?
- Yes. Indiana's median of 280 mg/L is 2× the national county median of 140 mg/L, and Indiana ranks #6 of the 50 states and D.C.
Compare
States with similar hardness
Two states measure closest to Indiana's 280 mg/L: Illinois at 285 mg/L and Ohio at 270 mg/L. Indiana measures harder than 90% of states. Browse the full ranking on the statistics page.
More: hardness scale · check your address · national statistics · the national map.
By Marko Visic, MPharm, BSc Physics. Source: USGS/EPA Water Quality Portal — 31,097 Indiana measurements. Data last verified . Methodology.
Cite this page: “Indiana Water Hardness by County.” Hard Water Map. Retrieved 2026-07-22, https://hardwatermap.com/water-hardness/indiana/