Iowa Water Hardness by County
Water in Iowa has a median hardness of 310 mg/L as CaCO₃ — "very hard" on the USGS scale — based on 22,531 measurements at 5,050 monitoring stations. Osceola County has the state's hardest measured water (1300 mg/L); Taylor County the softest (140). Rank: #2 of the 50 states and D.C.
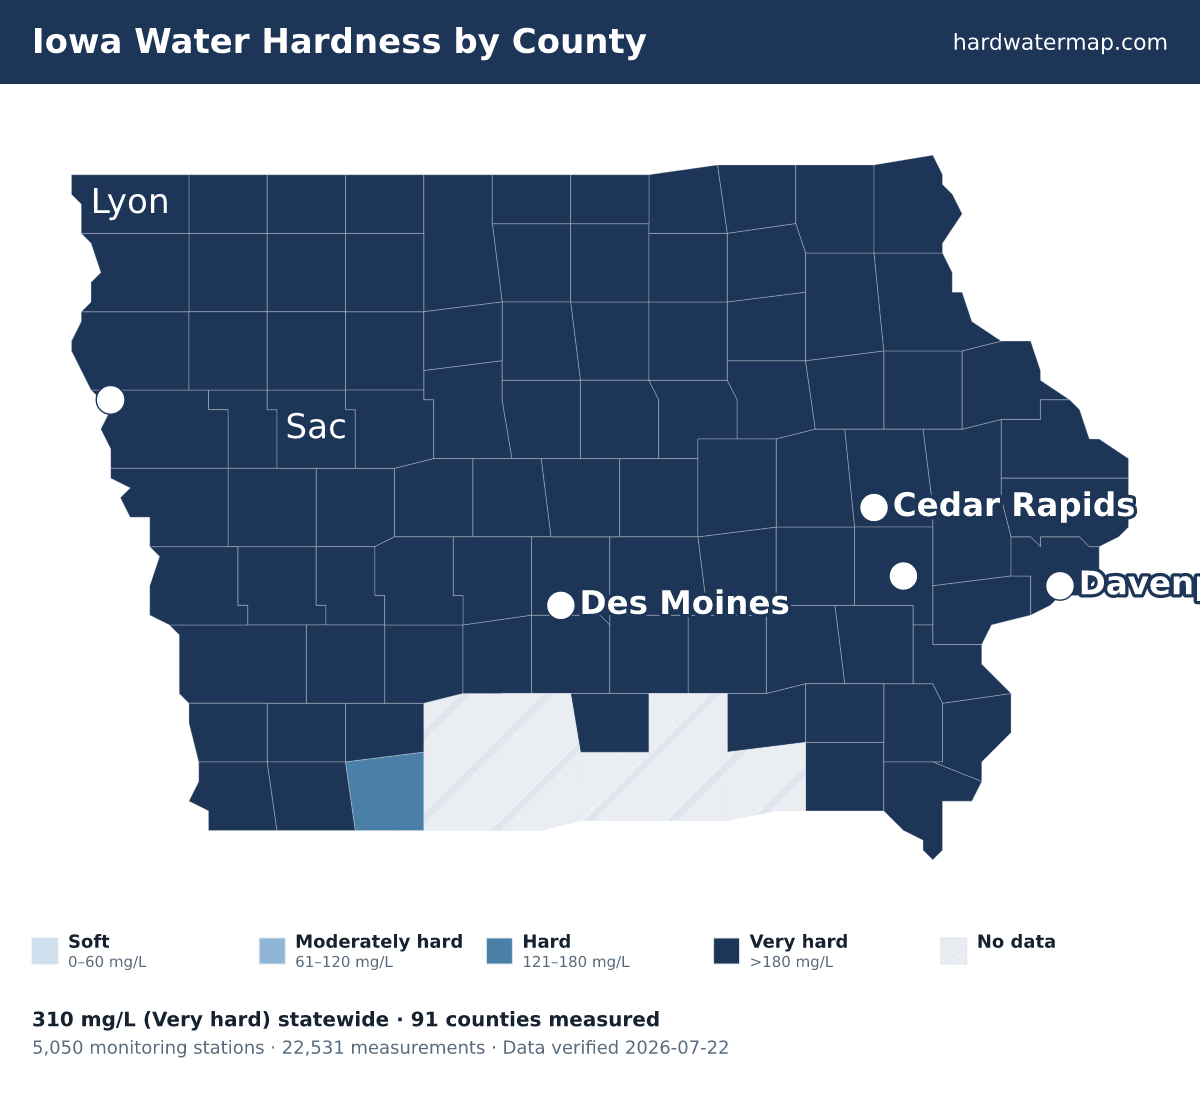
Iowa water hardness map — what the numbers mean. Data verified 2026-07-22.
Every one of Iowa's 91 measured counties tests hard or harder: 90 rank very hard and 1 rank hard. The hardest are Osceola County (1300 mg/L), Emmet County (760), and Pocahontas County (713.5). Even Taylor County, the softest measured area in the state, reads 140 mg/L — still hard on the USGS scale.
About 100% of Iowa's roughly 3.1 million residents in counties with gate-passing hardness data live where tap water is hard or worse.
Statewide, Iowa's median works out to 18.1 grains per gallon and ranks #2 of the 50 states and D.C. Across 22,531 measurements at 5,050 stations — 5,016 of them since 2000 — the middle 80% of readings fall between 170 and 580 mg/L. The public record runs from 1900 to 2023.
See where Iowa sits nationally on the national map, or what its number means on the hardness scale.
Download the Iowa water hardness map (PNG) — Water hardness by county in Iowa: 91 counties mapped from USGS/EPA data, statewide median 310 mg/L (very hard); darker counties have harder water.
By county
Water hardness by county
The table lists all 91 measured Iowa counties, hardest first. Their medians span 1300 mg/L in Osceola County to 140 in Taylor County — a 9.3× range. 8 more Iowa counties lack gate-passing data.
| County | Median | Band | Results | Sites | Newest |
|---|---|---|---|---|---|
| Osceola County | 1300 | Very hard | 75 | 30 | 2022 |
| Emmet County | 760 | Very hard | 107 | 30 | 2018 |
| Pocahontas County | 713.5 | Very hard | 80 | 36 | 2002 |
| Palo Alto County | 695 | Very hard | 88 | 30 | 2014 |
| Buena Vista County | 580 | Very hard | 207 | 65 | 2013 |
| Calhoun County | 580 | Very hard | 100 | 30 | 2014 |
| Cherokee County | 520 | Very hard | 169 | 58 | 2006 |
| Clay County | 515 | Very hard | 110 | 47 | 2006 |
| Sac County | 490 | Very hard | 186 | 70 | 2006 |
| Sioux County | 490 | Very hard | 489 | 91 | 2014 |
| O'Brien County | 470 | Very hard | 193 | 62 | 2013 |
| Webster County | 470 | Very hard | 332 | 97 | 2014 |
| Keokuk County | 460 | Very hard | 122 | 48 | 2017 |
| Poweshiek County | 460 | Very hard | 110 | 30 | 2017 |
| Crawford County | 440 | Very hard | 247 | 75 | 2006 |
| Kossuth County | 440 | Very hard | 177 | 52 | 2017 |
| Lyon County | 440 | Very hard | 449 | 56 | 2022 |
| Monona County | 430 | Very hard | 215 | 47 | 2020 |
| Woodbury County | 430 | Very hard | 331 | 96 | 2006 |
| Plymouth County | 426.7 | Very hard | 511 | 59 | 2006 |
| Ida County | 420 | Very hard | 154 | 40 | 2006 |
| Greene County | 410 | Very hard | 143 | 45 | 2006 |
| Harrison County | 410 | Very hard | 216 | 40 | 2006 |
| Shelby County | 410 | Very hard | 109 | 42 | 2006 |
| Humboldt County | 400 | Very hard | 151 | 52 | 2005 |
| Washington County | 400 | Very hard | 199 | 85 | 2017 |
| Henry County | 390 | Very hard | 179 | 48 | 2014 |
| Audubon County | 380 | Very hard | 92 | 28 | 2006 |
| Marshall County | 380 | Very hard | 160 | 65 | 2017 |
| Hancock County | 370 | Very hard | 131 | 22 | 2017 |
| Winnebago County | 367 | Very hard | 68 | 15 | 2014 |
| Story County | 365 | Very hard | 212 | 52 | 2013 |
| Boone County | 360 | Very hard | 157 | 22 | 2013 |
| Carroll County | 360 | Very hard | 268 | 106 | 2006 |
| Grundy County | 360 | Very hard | 152 | 56 | 2017 |
| Hamilton County | 360 | Very hard | 525 | 82 | 2018 |
| Jasper County | 360 | Very hard | 122 | 50 | 2011 |
| Wright County | 360 | Very hard | 213 | 35 | 2006 |
| Hardin County | 352 | Very hard | 744 | 115 | 2023 |
| Dallas County | 350 | Very hard | 253 | 58 | 2006 |
| Franklin County | 350 | Very hard | 115 | 24 | 2017 |
| Mills County | 350 | Very hard | 94 | 28 | 2006 |
| Tama County | 345 | Very hard | 439 | 91 | 2017 |
| Benton County | 340 | Very hard | 226 | 59 | 2017 |
| Cerro Gordo County | 340 | Very hard | 202 | 71 | 2017 |
| Mahaska County | 340 | Very hard | 121 | 57 | 2013 |
| Cedar County | 320 | Very hard | 134 | 40 | 2006 |
| Fayette County | 320 | Very hard | 160 | 52 | 2017 |
| Iowa County | 320 | Very hard | 514 | 131 | 2017 |
| Worth County | 320 | Very hard | 69 | 14 | 2017 |
| Allamakee County | 312 | Very hard | 120 | 31 | 2017 |
| Jackson County | 310 | Very hard | 160 | 38 | 2013 |
| Jones County | 310 | Very hard | 132 | 34 | 2017 |
| Winneshiek County | 305.5 | Very hard | 110 | 25 | 2013 |
| Polk County | 303.5 | Very hard | 694 | 66 | 2017 |
| Clayton County | 302.5 | Very hard | 338 | 71 | 2014 |
| Guthrie County | 300 | Very hard | 175 | 50 | 2013 |
| Pottawattamie County | 296.5 | Very hard | 172 | 49 | 2014 |
| Jefferson County | 290 | Very hard | 90 | 41 | 2017 |
| Van Buren County | 289 | Very hard | 345 | 39 | 2023 |
| Adams County | 280 | Very hard | 38 | 10 | 2006 |
| Buchanan County | 280 | Very hard | 136 | 31 | 2017 |
| Marion County | 280 | Very hard | 500 | 109 | 2014 |
| Mitchell County | 280 | Very hard | 200 | 12 | 2020 |
| Fremont County | 274.7 | Very hard | 189 | 34 | 2017 |
| Howard County | 270 | Very hard | 105 | 17 | 2006 |
| Johnson County | 270 | Very hard | 380 | 109 | 2017 |
| Wapello County | 270 | Very hard | 266 | 45 | 2014 |
| Black Hawk County | 262 | Very hard | 371 | 84 | 2017 |
| Delaware County | 260 | Very hard | 130 | 36 | 2014 |
| Dubuque County | 260 | Very hard | 287 | 46 | 2022 |
| Linn County | 260 | Very hard | 1,797 | 263 | 2023 |
| Warren County | 260 | Very hard | 177 | 71 | 2006 |
| Floyd County | 255 | Very hard | 204 | 38 | 2017 |
| Chickasaw County | 250 | Very hard | 55 | 17 | 2017 |
| Lucas County | 250 | Very hard | 156 | 74 | 2006 |
| Bremer County | 240 | Very hard | 223 | 43 | 2017 |
| Butler County | 240 | Very hard | 156 | 35 | 2017 |
| Page County | 240 | Very hard | 60 | 27 | 2006 |
| Louisa County | 238 | Very hard | 604 | 88 | 2023 |
| Des Moines County | 232 | Very hard | 346 | 70 | 2017 |
| Montgomery County | 230 | Very hard | 76 | 27 | 2013 |
| Dickinson County | 220 | Very hard | 131 | 24 | 2004 |
| Cass County | 200 | Very hard | 81 | 32 | 2006 |
| Lee County | 200 | Very hard | 373 | 78 | 2011 |
| Madison County | 200 | Very hard | 70 | 18 | 2004 |
| Scott County | 200 | Very hard | 221 | 24 | 2022 |
| Clinton County | 190 | Very hard | 707 | 59 | 2023 |
| Adair County | 180 | Very hard | 132 | 15 | 2006 |
| Muscatine County | 180 | Very hard | 354 | 135 | 2017 |
| Taylor County | 140 | Hard | 97 | 16 | 2006 |
ZIP codes
ZIP codes in Iowa
The ZIP codes below are grouped by the Iowa county each mostly falls within (by land area). Each ZIP takes that county's measured median — shown in the group header — so this is a ZIP-to-county guide, not a separate reading for every ZIP. To check the water system serving a specific address, use the lookup.
Key: a † after a ZIP means it has no mapped community water system — usually a private-well area. Plain ZIPs are served by a mapped community water system.
Osceola County · 1300 mg/L · Very hard
51232†51249†51345†51350†51354
Emmet County · 760 mg/L · Very hard
50514†50531†50578†51334†51365†
Pocahontas County · 713.5 mg/L · Very hard
50540†50541†50546†50554†50571†5057350574†50581†50593
Palo Alto County · 695 mg/L · Very hard
50515†50527†50528†5053650562†50597†51342†51358
Buena Vista County · 580 mg/L · Very hard
50510†50565†50568†50576†50585†50588†5059251002†
Calhoun County · 580 mg/L · Very hard
5053850551†50552†50561†5056350575†5057950586†5144951453†
Cherokee County · 520 mg/L · Very hard
51005†5101251014†51029†51035†51037†5104951061†
Clay County · 515 mg/L · Very hard
51033†51047†5130151333†51338†5134051341†51343†51357†51366†
Sac County · 490 mg/L · Very hard
50535†50567†5058351053†51433†51450†51458†51466†
Sioux County · 490 mg/L · Very hard
51003†51011†51023†51027†51036†51041†5120151234†51238†51239†5124451247†51250†
O'Brien County · 470 mg/L · Very hard
5100951022†51046†51058†51231†51245†51248†51346†
Webster County · 470 mg/L · Very hard
5050150516†50518†505215052350524†505305053250543505445055750566†5056950594†
Keokuk County · 460 mg/L · Very hard
50104†50136†50255†5026852231†52335†52355†52550†52562†52563†52568†52576†5258552591†
Poweshiek County · 460 mg/L · Very hard
5011250157†5017150242†52211†52221†52222†52232†
Crawford County · 440 mg/L · Very hard
51432†51439†51441†5144251448†51454†51460†51461†51465†5146751520†51528†
Kossuth County · 440 mg/L · Very hard
5045150480†50483†5051150517†50522†50539†50556†50559†50560†50590†50598†
Lyon County · 440 mg/L · Very hard
51230†51235†51237†51240†51241†51242†51243†51246
Monona County · 430 mg/L · Very hard
51010†5103451040†51051†51060†51063†51523†51558†51572†
Woodbury County · 430 mg/L · Very hard
51004†51007†51015†51016†51019†51026†51030†51039†51044†51048†51052†51054†51055†51056†5110151103†51104511055110651111†
Plymouth County · 426.7 mg/L · Very hard
51001†5100851024†51028†51031†51038†5104551050†51062†51108†51109†
Ida County · 420 mg/L · Very hard
51006†51018†51020†51025†51431†51445†
Greene County · 410 mg/L · Very hard
50050†500645010750129502175023551462†
Harrison County · 410 mg/L · Very hard
51529†51545†51546†51550†51555†51556†51557†51563†51564†51579†
Shelby County · 410 mg/L · Very hard
51446†51447†51527†51530†51531†51537†51562†51565†51570†51578†
Humboldt County · 400 mg/L · Very hard
50519†50520†5052950545†5054850558†50570†50577†50582†50591†
Washington County · 400 mg/L · Very hard
52201†52248†523275235352356†52359†52621†
Henry County · 390 mg/L · Very hard
5264152644526455264752649526525265452659
Audubon County · 380 mg/L · Very hard
50025†50042†50076†50110†50117†51543†
Marshall County · 380 mg/L · Very hard
50005†50051†50078†50106†50120†50141†5014250148†5015850162†50234†50239†50247
Hancock County · 370 mg/L · Very hard
50423†50430†50432†50438†50439†5044750449†50457†50484†
Winnebago County · 367 mg/L · Very hard
50424†50436†5045050453†50465†50473†50478†
Story County · 365 mg/L · Very hard
5001050012500135001450046†50055†50056†50105501245013450154†50201†50236†50248†50278
Boone County · 360 mg/L · Very hard
5003150036500405015250156502125022350276
Carroll County · 360 mg/L · Very hard
5140151430†51436†51440†51443†51444†5145151452†5145551459†51463†
Grundy County · 360 mg/L · Very hard
50609†50621†50624†50638†50642†50657†50669†5067350680†
Hamilton County · 360 mg/L · Very hard
50034†50075†5013050132†5023150246502495027150595
Jasper County · 360 mg/L · Very hard
50028†50054†50127†50135†50137†50153†50168†50170†5020850228†50232†50251†
Wright County · 360 mg/L · Very hard
50071†50101†50421†50470†5052550533†50542†50599†
Hardin County · 352 mg/L · Very hard
50006†50102†5012250126†50206†50230†50258†50269†5062750672†
Dallas County · 350 mg/L · Very hard
500035003850039500635006650069501465016750220†50233502635026650323
Franklin County · 350 mg/L · Very hard
50041†50227†50420†50427†50431†5044150452†50475†50601†50605†50633
Mills County · 350 mg/L · Very hard
515345154051541†51551†51554†51561†51571†
Tama County · 345 mg/L · Very hard
50173†50612†50632†50635†50652†50675†52215†52217†52225†52339†52342†52348†
Benton County · 340 mg/L · Very hard
52206†52208†52209†52224†52229†52249†52257†52313†52315†52318†52332†52345†52346523495235152354†
Cerro Gordo County · 340 mg/L · Very hard
504015042850433†50464†50467†50469†50477†50479†50482
Mahaska County · 340 mg/L · Very hard
50027†50143†50207†52534†52543†52561†5257752586†52595
Cedar County · 320 mg/L · Very hard
52216†52253†52255†52306†52337†52358†52721†52772†52778†
Fayette County · 320 mg/L · Very hard
50606†50655†50662†50664†50671†50681†52135†52141†52142†52147†52164†5216652169†52171†52175†
Iowa County · 320 mg/L · Very hard
52203†52220†52236†52251†52301†523075230852316†52325†52334†52347†52361†
Worth County · 320 mg/L · Very hard
50434†5044050444†50446†50448†50456†50459†
Allamakee County · 312 mg/L · Very hard
52140†52146†52151†52159†52160†52162†52170†52172
Jackson County · 310 mg/L · Very hard
5203052031†52054†52060†52064†52069†52070†52071†52074†5207552079†52207†52309†
Jones County · 310 mg/L · Very hard
52033†52205†52212†52252†52305†52310†523125232052321†5232352362
Winneshiek County · 305.5 mg/L · Very hard
52101†52132†52133†52144†52161†52165†52168
Polk County · 303.5 mg/L · Very hard
500075000950021†50023500325003550073501095011150131†50161†50169502265023750243502445026550309503105031150312503135031450315503165031750319503205032150322503245032550327
Clayton County · 302.5 mg/L · Very hard
52035†52042†52043†52044†52047†52048†52049†52052†52066†52072†52076†52077†52156†52157†52158†
Guthrie County · 300 mg/L · Very hard
50002†50026†50029†5004850058†50115†501285016450216†50277
Pottawattamie County · 296.5 mg/L · Very hard
5150151503†51510515215152551526†51536†51542†51548†51549†51553†51559†5156051575†51576†51577†
Jefferson County · 290 mg/L · Very hard
5253352540†52556†525575256752580†52635†
Van Buren County · 289 mg/L · Very hard
525355254252551525655257052573525885262052651
Adams County · 280 mg/L · Very hard
50839†50841†50857†50859†
Buchanan County · 280 mg/L · Very hard
50607†50629†50641†5064450650†50654†50682†52210†52326†52329†
Marion County · 280 mg/L · Very hard
500445005750062501165011950138501635021450219†502255025250256
Mitchell County · 280 mg/L · Very hard
50426†50454†50455†50460†50461†50472†50476†
Fremont County · 274.7 mg/L · Very hard
51639†51640†51645†51648†51649†51650†51652†51653†51654†
Howard County · 270 mg/L · Very hard
50466†50628†52134†5213652155†52163†
Johnson County · 270 mg/L · Very hard
52235†522405224152242522455224652247†52317†52322†5233352338†5234052755
Wapello County · 270 mg/L · Very hard
52501525305253652548†5255352554†52566†
Black Hawk County · 262 mg/L · Very hard
5061350623†506265063450643†50648†50651†50667†50701†5070250703†50707
Delaware County · 260 mg/L · Very hard
52036†52038†52040†52041†52050†5205752223†5223752330†
Dubuque County · 260 mg/L · Very hard
52001†52002†52003†52032†52039†52045†5204652053†52056†52065†52068†52073†52078
Linn County · 260 mg/L · Very hard
52202†52213†52214†52218†5221952227†52228†5223352302†52314†52324†5232852336†52341†52344†52352524015240252403524045240552411
Warren County · 260 mg/L · Very hard
5000150047†5011850125†5013950145†5016050166†50210†50211†50229†50241
Floyd County · 255 mg/L · Very hard
50435†50458†50468†50471†50616†5062050653†
Chickasaw County · 250 mg/L · Very hard
50603†50630†50645†5065850659†52154†
Lucas County · 250 mg/L · Very hard
5004950068501515023850272
Bremer County · 240 mg/L · Very hard
5062250631†50647†50666†50668†50674†50676†50677†
Butler County · 240 mg/L · Very hard
50602†50604†50608†50611†50619†50625†5063650649†50660†5066550670†
Page County · 240 mg/L · Very hard
51601†51630†51631†5163251636†51637†51638†51647†5165151656†
Louisa County · 238 mg/L · Very hard
52640†52653†5273752738†52739†52752†
Des Moines County · 232 mg/L · Very hard
52601526235263752638†52646526505265552660
Montgomery County · 230 mg/L · Very hard
50847†50864†51532†51533†5156651573
Dickinson County · 220 mg/L · Very hard
51331†51347†51351†5135551360†51363†51364†
Cass County · 200 mg/L · Very hard
50020†50022†50274†50843†50853†51535†51544†51552†
Lee County · 200 mg/L · Very hard
5261952624526255262652627526305263152632†52639526565265752658
Madison County · 200 mg/L · Very hard
50033†50061†5007050072†50149†50155†50218†50222†50240†50257†50261†50273†
Scott County · 200 mg/L · Very hard
5272252726†5272852745†52746†52748†52753†52756†52758†52765†5276752768†52769†52773†52801528025280352804†52806†52807†
Clinton County · 190 mg/L · Very hard
52037†52254†52701†52727†52729†52730†52731†52732†52742†52750†52751†5275752771†52774†52777†
Adair County · 180 mg/L · Very hard
5025050837†50846†50849†50858†
Muscatine County · 180 mg/L · Very hard
52720†5274752749†52754†52759†52760†5276152766†52776†
Taylor County · 140 mg/L · Hard
50833†50836†50840†50848†50851†50862†51646†
† 646 ZIP codes are not served by a mapped community water system — most are private-well areas. See well water hardness.
Source
Groundwater vs surface water
Iowa's groundwater measures harder than its surface water — 353 mg/L across 14,522 samples versus 248 across 7,985, about 1.4× harder. Wells draw from groundwater, so well owners in Iowa tend to see the harder number — 353 mg/L, very hard. Groundwater readings there run 220 to 710 mg/L across the middle 80% of samples. The comparison draws on 4,655 groundwater and 393 surface-water monitoring sites; 54 readings above 2,000 mg/L were logged but held out of the medians as outliers.
Groundwater (wells)
353 mg/L as CaCO₃ · 14,522 results at 4,655 stations.
Surface water (rivers, lakes)
248 mg/L as CaCO₃ · 7,985 results at 393 stations.
Groundwater measures about 1.4× harder than surface water here.
Chemistry
Water chemistry in Iowa
Beyond the hardness number, Iowa's water carries a fuller chemical signature — here is how its measured parameters compare to national benchmarks.
TDS
328 mg/L · n=3,795
328 mg/L — about 1.5× the national county median of 226, consistent with hard, mineral-rich water.
pH
8.2 pH · n=3,060
pH 8.2 — within the EPA secondary range of 6.5–8.5, on the alkaline side.
Alkalinity
204 mg/L as CaCO3 · n=7,562
204 mg/L — substantial buffering capacity, which resists pH swings.
Calcium : Magnesium
67.6 : 22 mg/L ≈ 3.07 : 1 · n=5,013
Calcium is about 65% of Iowa's hardness (67.6 mg/L Ca to 22 mg/L Mg), a little more magnesium-rich than the national ~68% calcium share.
Parameter medians may include a small share of quality-control samples; the hardness lane is fully QC-filtered.
Aquifers
Major aquifers under Iowa
3 aquifer systems supply much of Iowa's measured groundwater.
- Lower Cretaceous aquifers — median 480 mg/L across 521 samples at 164 sites: very hard.
- Mississippian aquifers — median 400 mg/L across 181 samples at 43 sites: very hard.
- Cambrian-Ordovician aquifer system — median 340 mg/L across 1,020 samples at 191 sites: very hard.
Together these systems account for 1,722 measured samples at 398 sites. Aquifer medians pool samples across a whole system and can mask local variation — see the national aquifer map for how these compare across states.
Trend
Hardness over time
Iowa's decade median moved from 206 mg/L in the 1900s to 262 in the 2020s. Over the series, the decade median peaked at 400 mg/L in the 1930s and bottomed at 206 in the 1900s. Decade medians reflect where and what agencies sampled in each era, not just changes in the water itself.
Scale
Where Iowa sits on the scale
On the USGS scale, Iowa's 310 mg/L is very hard — 18.1 grains per gallon, well above the 180 mg/L very-hard cutoff — among the hardest water measured in the US.
At 310 mg/L (18.1 gpg), water-softener owners in Iowa typically set their unit to this hardness — settings calculator.
Questions
Frequently asked questions
- Is Iowa's water hard?
- Iowa's median hardness is 310 mg/L as CaCO₃, "very hard" on the USGS scale and 2.21× the national county median of 140 mg/L. About 100% of residents in measured counties have hard-or-worse water.
- Which county in Iowa has the hardest water?
- Osceola County, with a median of 1300 mg/L as CaCO₃ across 75 measurements. Even the softest, Taylor County at 140 mg/L, is still "hard" on the USGS scale.
- Is well water harder than city water in Iowa?
- Groundwater measures harder here — about 1.4× the surface water — so wells tend to run harder (groundwater 353 vs surface water 248 mg/L).
- How do I find my exact hardness in Iowa?
- Search your ZIP on the lookup tool, read your utility's Consumer Confidence Report, or test at home with a kit.
- Is Iowa's water harder than the national average?
- Yes. Iowa's median of 310 mg/L is 2.21× the national county median of 140 mg/L, and Iowa ranks #2 of the 50 states and D.C.
Compare
States with similar hardness
Two states measure closest to Iowa's 310 mg/L: North Dakota at 310 mg/L and Arizona at 300 mg/L. Iowa measures harder than 98% of states. Browse the full ranking on the statistics page.
More: hardness scale · check your address · national statistics · the national map.
By Marko Visic, MPharm, BSc Physics. Source: USGS/EPA Water Quality Portal — 22,531 Iowa measurements. Data last verified . Methodology.
Cite this page: “Iowa Water Hardness by County.” Hard Water Map. Retrieved 2026-07-22, https://hardwatermap.com/water-hardness/iowa/