North Dakota Water Hardness by County
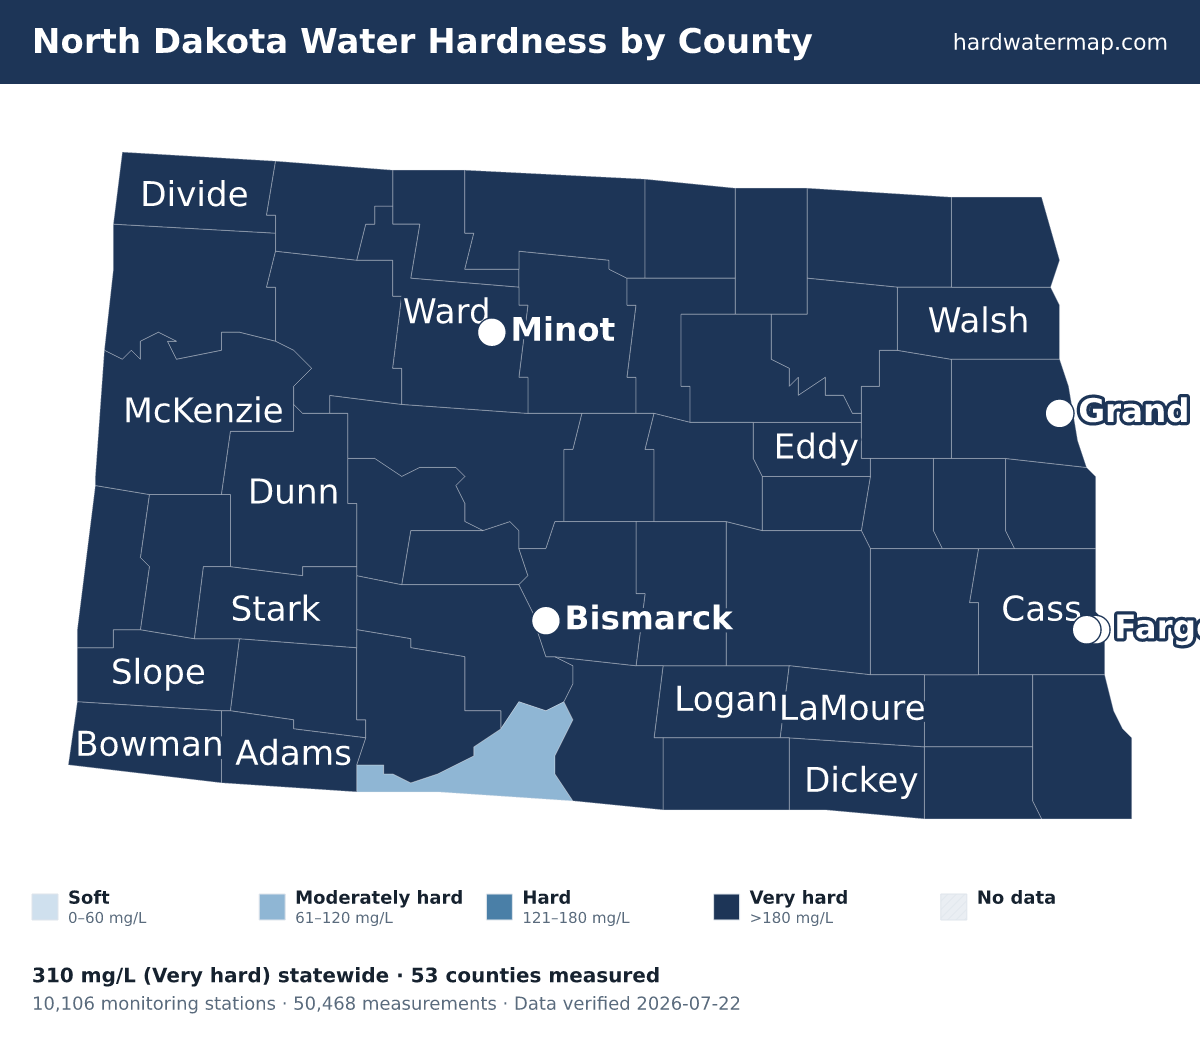
Water in North Dakota has a median hardness of 310 mg/L as CaCO₃ — "very hard" on the USGS scale — based on 50,468 measurements at 10,106 monitoring stations. Nelson County has the state's hardest measured water (589.5 mg/L); Sioux County the softest (119.5). Rank: #3 of the 50 states and D.C.
North Dakota water hardness map — what the numbers mean. Data verified 2026-07-22.
Of North Dakota's 53 measured counties, 52 very hard and 1 moderately hard. The hardest are Nelson County (589.5 mg/L), Steele County (520), and Ramsey County (481). Sioux County is the softest at 119.5 mg/L (moderately hard).
About 100% of North Dakota's roughly 0.8 million residents in counties with gate-passing hardness data live where tap water is hard or worse.
Statewide, North Dakota's median works out to 18.1 grains per gallon and ranks #3 of the 50 states and D.C. Across 50,468 measurements at 10,106 stations — 12,696 of them since 2000 — the middle 80% of readings fall between 136 and 650 mg/L. The public record runs from 1921 to 2024.
See where North Dakota sits nationally on the national map, or what its number means on the hardness scale.
Download the North Dakota water hardness map (PNG) — Water hardness by county in North Dakota: 53 counties mapped from USGS/EPA data, statewide median 310 mg/L (very hard); darker counties have harder water.
By county
Water hardness by county
The table lists all 53 measured North Dakota counties, hardest first. Their medians span 589.5 mg/L in Nelson County to 119.5 in Sioux County — a 4.9× range.
| County | Median | Band | Results | Sites | Newest |
|---|---|---|---|---|---|
| Nelson County | 589.5 | Very hard | 811 | 178 | 2024 |
| Steele County | 520 | Very hard | 408 | 159 | 2012 |
| Ramsey County | 481 | Very hard | 2,927 | 276 | 2024 |
| Towner County | 460 | Very hard | 645 | 195 | 2023 |
| Traill County | 427.5 | Very hard | 806 | 89 | 2024 |
| Divide County | 391 | Very hard | 347 | 156 | 2023 |
| McIntosh County | 390 | Very hard | 279 | 189 | 2016 |
| Adams County | 388 | Very hard | 323 | 121 | 2024 |
| Sargent County | 380 | Very hard | 517 | 249 | 2023 |
| Williams County | 377.5 | Very hard | 824 | 250 | 2023 |
| Hettinger County | 370 | Very hard | 650 | 155 | 2024 |
| Rolette County | 369 | Very hard | 248 | 149 | 2022 |
| Golden Valley County | 365 | Very hard | 336 | 121 | 2023 |
| Walsh County | 360 | Very hard | 1,170 | 146 | 2024 |
| Benson County | 353 | Very hard | 1,321 | 277 | 2023 |
| Richland County | 351 | Very hard | 927 | 143 | 2023 |
| Barnes County | 342 | Very hard | 887 | 118 | 2024 |
| Grant County | 338 | Very hard | 940 | 148 | 2023 |
| Dickey County | 333 | Very hard | 2,950 | 541 | 2023 |
| Logan County | 330 | Very hard | 278 | 230 | 2016 |
| Ward County | 328 | Very hard | 1,377 | 143 | 2024 |
| McHenry County | 324 | Very hard | 2,379 | 262 | 2023 |
| Bottineau County | 322 | Very hard | 1,185 | 129 | 2023 |
| Grand Forks County | 320 | Very hard | 1,661 | 138 | 2024 |
| Griggs County | 320 | Very hard | 688 | 154 | 2016 |
| Renville County | 319 | Very hard | 567 | 36 | 2023 |
| Oliver County | 310 | Very hard | 371 | 59 | 2023 |
| Sheridan County | 305 | Very hard | 156 | 102 | 2016 |
| Pembina County | 303 | Very hard | 1,752 | 139 | 2023 |
| Emmons County | 300 | Very hard | 501 | 262 | 2024 |
| LaMoure County | 300 | Very hard | 668 | 253 | 2016 |
| Ransom County | 300 | Very hard | 1,215 | 240 | 2024 |
| Foster County | 296 | Very hard | 453 | 67 | 2016 |
| Cass County | 290 | Very hard | 2,714 | 242 | 2023 |
| Stark County | 282.5 | Very hard | 1,103 | 253 | 2023 |
| Burleigh County | 280 | Very hard | 1,040 | 187 | 2024 |
| Kidder County | 280 | Very hard | 161 | 111 | 2018 |
| Morton County | 280 | Very hard | 1,280 | 363 | 2023 |
| Stutsman County | 280 | Very hard | 1,251 | 181 | 2024 |
| Mountrail County | 279.5 | Very hard | 721 | 225 | 2023 |
| Pierce County | 278 | Very hard | 172 | 95 | 2003 |
| Eddy County | 260 | Very hard | 901 | 120 | 2024 |
| Wells County | 260 | Very hard | 465 | 87 | 2023 |
| McLean County | 252 | Very hard | 2,003 | 416 | 2023 |
| Cavalier County | 250 | Very hard | 599 | 181 | 2023 |
| Mercer County | 240 | Very hard | 2,035 | 190 | 2024 |
| Slope County | 237 | Very hard | 565 | 122 | 2024 |
| Billings County | 230 | Very hard | 702 | 200 | 2023 |
| Bowman County | 230 | Very hard | 1,131 | 257 | 2018 |
| Burke County | 227 | Very hard | 373 | 211 | 2020 |
| Dunn County | 220 | Very hard | 969 | 431 | 2023 |
| McKenzie County | 220 | Very hard | 1,452 | 255 | 2023 |
| Sioux County | 119.5 | Moderately hard | 264 | 105 | 2023 |
ZIP codes
ZIP codes in North Dakota
The ZIP codes below are grouped by the North Dakota county each mostly falls within (by land area). Each ZIP takes that county's measured median — shown in the group header — so this is a ZIP-to-county guide, not a separate reading for every ZIP. To check the water system serving a specific address, use the lookup.
Key: a † after a ZIP means it has no mapped community water system — usually a private-well area. Plain ZIPs are served by a mapped community water system.
Nelson County · 589.5 mg/L · Very hard
582125822458254†582595827258344†5836158380
Steele County · 520 mg/L · Very hard
580465805658230582405827458277
Ramsey County · 481 mg/L · Very hard
58301583215832558327583305833858345583625837758382
Towner County · 460 mg/L · Very hard
58317583245833158339583635836558372
Traill County · 427.5 mg/L · Very hard
580095801658035580385804558218582195822358257
Divide County · 391 mg/L · Very hard
58730†587655879558833†58844†
McIntosh County · 390 mg/L · Very hard
584135849558581
Adams County · 388 mg/L · Very hard
58639†58649†
Sargent County · 380 mg/L · Very hard
5801358017580325804058043580605806758069
Williams County · 377.5 mg/L · Very hard
587555880158830588435884558849588525885358856
Hettinger County · 370 mg/L · Very hard
58646†58650†
Rolette County · 369 mg/L · Very hard
583105831658329†58353583665836758369†
Golden Valley County · 365 mg/L · Very hard
58621†58632†58654†
Walsh County · 360 mg/L · Very hard
5821058227582295823158233582375824358250582615827058273
Benson County · 353 mg/L · Very hard
58332†5833558343583465834858351†58357583705837958386
Richland County · 351 mg/L · Very hard
580015800858015580185803058041580535805758058580615807458075580765807758081
Barnes County · 342 mg/L · Very hard
5804958062580635806558072584295846158479584805848158492
Grant County · 338 mg/L · Very hard
58529†58533†58562†58564†58569†
Dickey County · 333 mg/L · Very hard
5843658439584415845658474
Logan County · 330 mg/L · Very hard
58440584425846058561
Ward County · 328 mg/L · Very hard
5870158703587045870558707587185872258733587345873558746587565878158785
McHenry County · 324 mg/L · Very hard
587105871258713587315873658741587445876858788587895879058792
Bottineau County · 322 mg/L · Very hard
583185838458711587485875058760587625878358793
Grand Forks County · 320 mg/L · Very hard
5820158202†58203†58204582055821458228582355824458251582565825858266582675827558278
Griggs County · 320 mg/L · Very hard
5841658425584485845258484
Renville County · 319 mg/L · Very hard
5872558740587615878258787
Oliver County · 310 mg/L · Very hard
58530†
Sheridan County · 305 mg/L · Very hard
58430584445846358758
Pembina County · 303 mg/L · Very hard
582165822058222582255823658238582415826258265582715827658282
Emmons County · 300 mg/L · Very hard
57648585245854258544585495855258573
LaMoure County · 300 mg/L · Very hard
58415584315843358454584585846658490
Ransom County · 300 mg/L · Very hard
58027580335805458068
Foster County · 296 mg/L · Very hard
584215844358445
Cass County · 290 mg/L · Very hard
5800258004580055800658007580115801258021580295803158036580425804758048580515805258059580645807158078†5807958102581035810458105†
Stark County · 282.5 mg/L · Very hard
58601†58630†58641†58652†58655†58656†
Burleigh County · 280 mg/L · Very hard
584775849458501585035850458505585215853258558585605857258579
Kidder County · 280 mg/L · Very hard
584285847558478584825848758488
Morton County · 280 mg/L · Very hard
58520†585355855458563585665857058631†58638†
Stutsman County · 280 mg/L · Very hard
58401584025840558420584245842658455584675847258476584835849658497
Mountrail County · 279.5 mg/L · Very hard
58763587695877058771587765878458794
Pierce County · 278 mg/L · Very hard
58313†5836858385
Eddy County · 260 mg/L · Very hard
58356583745838158464
Wells County · 260 mg/L · Very hard
58341584185842258423584385845158486
McLean County · 252 mg/L · Very hard
58531†585405855958565585755857658577587165872358759587755877858779
Cavalier County · 250 mg/L · Very hard
58239582495825558260582695828158311583235835258355
Mercer County · 240 mg/L · Very hard
5852358541†58545†58571†58580†
Slope County · 237 mg/L · Very hard
58620†58647†
Billings County · 230 mg/L · Very hard
58622†58627†58645†
Bowman County · 230 mg/L · Very hard
58623†58643†58651†58653†
Burke County · 227 mg/L · Very hard
587215872758737†5875258772†58773
Dunn County · 220 mg/L · Very hard
58625†58626†58636†58640†58642†58644†58757
McKenzie County · 220 mg/L · Very hard
58634†5883158835588385884758854
Sioux County · 119.5 mg/L · Moderately hard
585285853858568
† 59 ZIP codes are not served by a mapped community water system — most are private-well areas. See well water hardness.
Source
Groundwater vs surface water
North Dakota's surface water measures harder than its groundwater — 315 mg/L across 36,319 samples versus 300 across 14,109, about 1.1× harder. For well owners that is the better side of a hard bargain: at 300 mg/L, North Dakota groundwater is still very hard, and most of the state's drinking water is pumped from it. Groundwater readings there run 26 to 740 mg/L across the middle 80% of samples. The comparison draws on 8,721 groundwater and 1,381 surface-water monitoring sites; 832 readings above 2,000 mg/L were logged but held out of the medians as outliers.
Groundwater (wells)
300 mg/L as CaCO₃ · 14,109 results at 8,721 stations.
Surface water (rivers, lakes)
315 mg/L as CaCO₃ · 36,319 results at 1,381 stations.
Surface water measures about 1.1× harder than groundwater here.
Chemistry
Water chemistry in North Dakota
Beyond the hardness number, North Dakota's water carries a fuller chemical signature — here is how its measured parameters compare to national benchmarks.
TDS
848 mg/L · n=8,101
848 mg/L — about 3.8× the national county median of 226, consistent with hard, mineral-rich water.
pH
8.3 pH · n=16,898
pH 8.3 — within the EPA secondary range of 6.5–8.5, on the alkaline side.
Alkalinity
280 mg/L as CaCO3 · n=16,792
280 mg/L — substantial buffering capacity, which resists pH swings.
Calcium : Magnesium
70.2 : 50 mg/L ≈ 1.4 : 1 · n=15,461
Calcium is about 46% of North Dakota's hardness (70.2 mg/L Ca to 50 mg/L Mg), a little more magnesium-rich than the national ~68% calcium share.
Parameter medians may include a small share of quality-control samples; the hardness lane is fully QC-filtered.
Aquifers
Major aquifers under North Dakota
3 aquifer systems supply much of North Dakota's measured groundwater.
- Sand and gravel aquifers (glaciated regions) — median 340 mg/L across 4,488 samples at 3,087 sites: very hard.
- Alluvial aquifers — median 330 mg/L across 3,182 samples at 1,164 sites: very hard.
- Paleozoic aquifers — median 300 mg/L across 13 samples at 8 sites: very hard.
Together these systems account for 7,683 measured samples at 4,259 sites. Aquifer medians pool samples across a whole system and can mask local variation — see the national aquifer map for how these compare across states.
Trend
Hardness over time
North Dakota's decade median moved from 380 mg/L in the 1930s to 426 in the 2020s. Over the series, the decade median peaked at 429 mg/L in the 2010s and bottomed at 260 in the 1950s. Decade medians reflect where and what agencies sampled in each era, not just changes in the water itself.
Scale
Where North Dakota sits on the scale
On the USGS scale, North Dakota's 310 mg/L is very hard — 18.1 grains per gallon, well above the 180 mg/L very-hard cutoff — among the hardest water measured in the US.
At 310 mg/L (18.1 gpg), water-softener owners in North Dakota typically set their unit to this hardness — settings calculator.
Questions
Frequently asked questions
- Is North Dakota's water hard?
- North Dakota's median hardness is 310 mg/L as CaCO₃, "very hard" on the USGS scale and 2.21× the national county median of 140 mg/L. About 100% of residents in measured counties have hard-or-worse water.
- Which county in North Dakota has the hardest water?
- Nelson County, with a median of 589.5 mg/L as CaCO₃ across 811 measurements. Even the softest, Sioux County at 119.5 mg/L, is still "moderately hard" on the USGS scale.
- Is well water harder than city water in North Dakota?
- Surface water measures harder here — about 1.1× the groundwater — so wells tend to run softer (groundwater 300 vs surface water 315 mg/L).
- How do I find my exact hardness in North Dakota?
- Search your ZIP on the lookup tool, read your utility's Consumer Confidence Report, or test at home with a kit.
- Is North Dakota's water harder than the national average?
- Yes. North Dakota's median of 310 mg/L is 2.21× the national county median of 140 mg/L, and North Dakota ranks #3 of the 50 states and D.C.
Compare
States with similar hardness
Two states measure closest to North Dakota's 310 mg/L: Iowa at 310 mg/L and Arizona at 300 mg/L. North Dakota measures harder than 96% of states. Browse the full ranking on the statistics page.
More: hardness scale · check your address · national statistics · the national map.
By Marko Visic, MPharm, BSc Physics. Source: USGS/EPA Water Quality Portal — 50,468 North Dakota measurements. Data last verified . Methodology.
Cite this page: “North Dakota Water Hardness by County.” Hard Water Map. Retrieved 2026-07-22, https://hardwatermap.com/water-hardness/north-dakota/