Louisiana Water Hardness by County
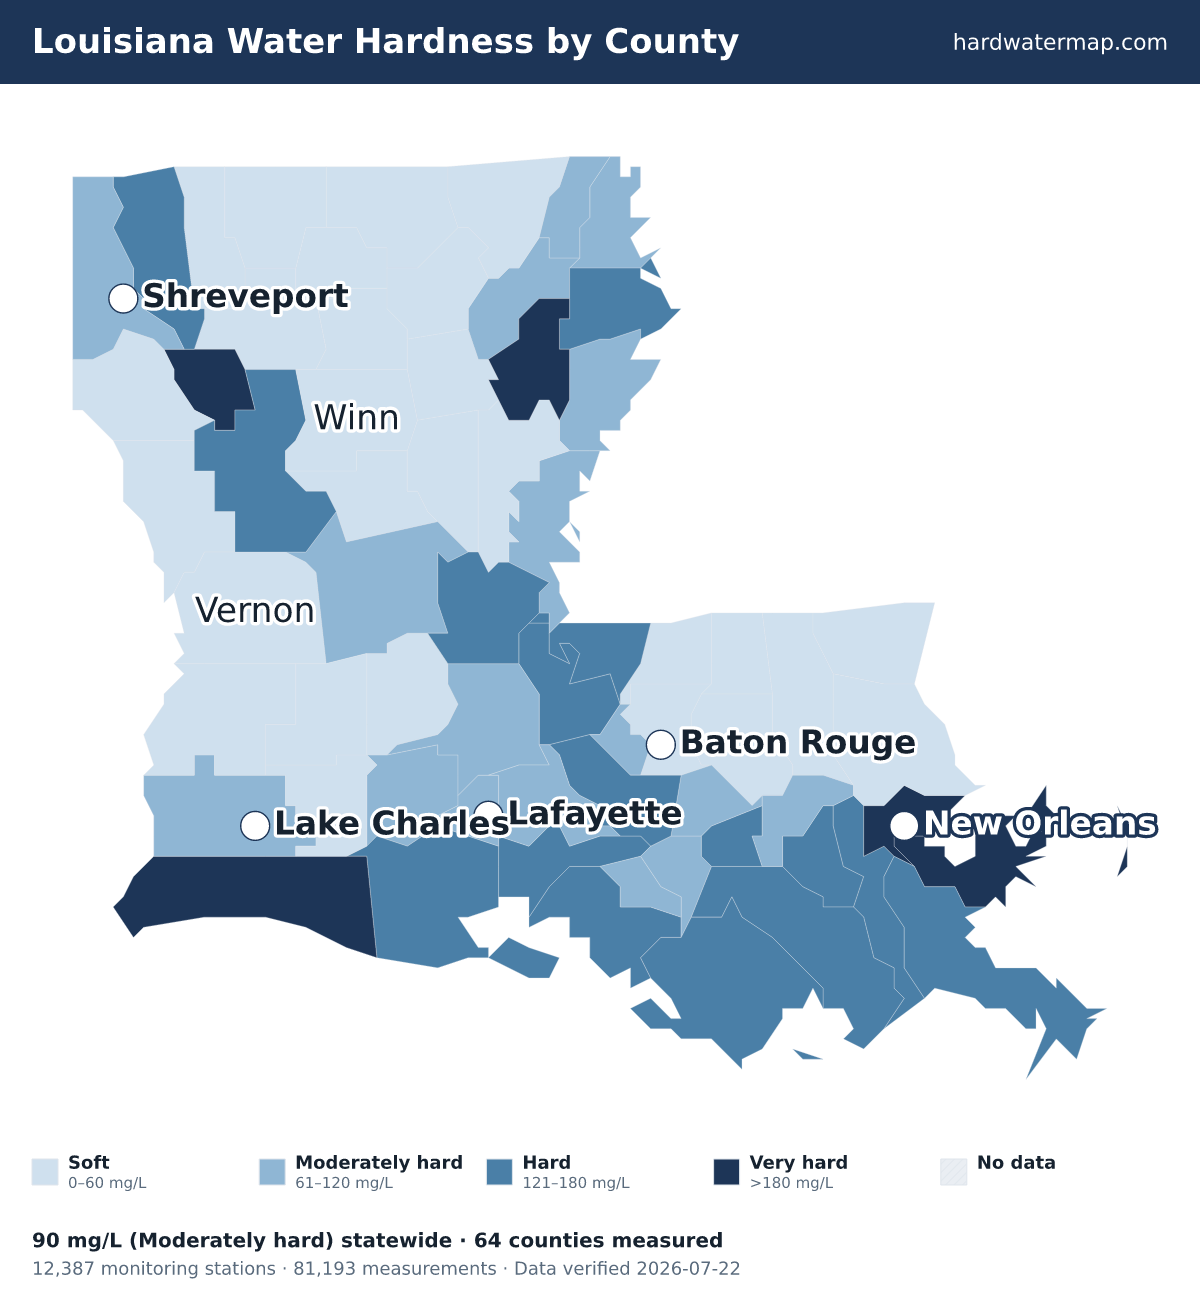
Water in Louisiana has a median hardness of 90 mg/L as CaCO₃ — "moderately hard" on the USGS scale — based on 81,193 measurements at 12,387 monitoring stations. St. Bernard County has the state's hardest measured water (500 mg/L); St. Helena County the softest (6). Rank: #27 of the 50 states and D.C.
Louisiana water hardness map — what the numbers mean. Data verified 2026-07-22.
Of Louisiana's 64 measured counties, 5 very hard, 16 hard, 16 moderately hard, and 27 soft. The hardest are St. Bernard County (500 mg/L), Red River County (260), and Franklin County (197). St. Helena County is the softest at 6 mg/L (soft).
About 35% of Louisiana's roughly 4.6 million residents in counties with gate-passing hardness data live where tap water is hard or worse.
Statewide, Louisiana's median works out to 5.3 grains per gallon and ranks #27 of the 50 states and D.C. Across 81,193 measurements at 12,387 stations — 38,201 of them since 2000 — the middle 80% of readings fall between 11 and 460 mg/L. The public record runs from 1902 to 2026.
See where Louisiana sits nationally on the national map, or what its number means on the hardness scale.
Download the Louisiana water hardness map (PNG) — Water hardness by county in Louisiana: 64 counties mapped from USGS/EPA data, statewide median 90 mg/L (moderately hard); darker counties have harder water.
By county
Water hardness by county
The table lists all 64 measured Louisiana counties, hardest first. Their medians span 500 mg/L in St. Bernard County to 6 in St. Helena County — a 83.3× range.
| County | Median | Band | Results | Sites | Newest |
|---|---|---|---|---|---|
| St. Bernard County | 500 | Very hard | 1,325 | 64 | 2023 |
| Red River County | 260 | Very hard | 1,428 | 136 | 2023 |
| Franklin County | 197 | Very hard | 765 | 314 | 2024 |
| Cameron County | 190 | Very hard | 1,434 | 188 | 2024 |
| Orleans County | 190 | Very hard | 1,856 | 211 | 2023 |
| Jefferson County | 165 | Hard | 1,593 | 211 | 2024 |
| Plaquemines County | 164 | Hard | 2,064 | 119 | 2024 |
| Terrebonne County | 154 | Hard | 2,656 | 107 | 2024 |
| Bossier County | 150 | Hard | 2,555 | 299 | 2024 |
| Natchitoches County | 149.5 | Hard | 1,852 | 324 | 2024 |
| St. Charles County | 147 | Hard | 1,569 | 143 | 2024 |
| Iberia County | 143 | Hard | 890 | 103 | 2023 |
| Iberville County | 140 | Hard | 1,624 | 236 | 2024 |
| St. James County | 140 | Hard | 785 | 160 | 2022 |
| Vermilion County | 140 | Hard | 1,924 | 197 | 2024 |
| West Feliciana County | 140 | Hard | 1,577 | 113 | 2024 |
| Lafourche County | 132 | Hard | 1,676 | 67 | 2024 |
| Avoyelles County | 130 | Hard | 1,792 | 415 | 2024 |
| Madison County | 130 | Hard | 402 | 51 | 2022 |
| Pointe Coupee County | 130 | Hard | 1,168 | 144 | 2024 |
| St. Mary County | 130 | Hard | 3,212 | 143 | 2024 |
| Assumption County | 114 | Moderately hard | 360 | 66 | 2021 |
| Calcasieu County | 110 | Moderately hard | 2,825 | 467 | 2024 |
| Richland County | 110 | Moderately hard | 679 | 118 | 2023 |
| West Baton Rouge County | 100 | Moderately hard | 994 | 119 | 2024 |
| West Carroll County | 98 | Moderately hard | 373 | 69 | 2025 |
| St. Martin County | 97.2 | Moderately hard | 775 | 154 | 2023 |
| St. Landry County | 96 | Moderately hard | 1,480 | 231 | 2024 |
| Rapides County | 95 | Moderately hard | 4,098 | 827 | 2024 |
| Ascension County | 94 | Moderately hard | 743 | 225 | 2022 |
| Acadia County | 92 | Moderately hard | 871 | 151 | 2024 |
| Caddo County | 91.7 | Moderately hard | 2,419 | 439 | 2024 |
| Lafayette County | 87 | Moderately hard | 535 | 155 | 2023 |
| East Carroll County | 84.8 | Moderately hard | 310 | 59 | 2022 |
| Concordia County | 82.1 | Moderately hard | 802 | 110 | 2023 |
| St. John the Baptist County | 78 | Moderately hard | 659 | 165 | 2022 |
| Tensas County | 71 | Moderately hard | 316 | 60 | 2022 |
| Jefferson Davis County | 55.7 | Soft | 880 | 176 | 2024 |
| Catahoula County | 52 | Soft | 2,211 | 182 | 2024 |
| De Soto County | 45 | Soft | 723 | 220 | 2024 |
| Evangeline County | 44.2 | Soft | 593 | 182 | 2024 |
| Morehouse County | 44 | Soft | 1,068 | 282 | 2025 |
| Webster County | 36 | Soft | 674 | 235 | 2023 |
| St. Tammany County | 34 | Soft | 4,250 | 282 | 2024 |
| Caldwell County | 33 | Soft | 585 | 93 | 2024 |
| Sabine County | 28 | Soft | 364 | 150 | 2022 |
| LaSalle County | 26 | Soft | 1,034 | 210 | 2024 |
| Ouachita County | 26 | Soft | 1,611 | 368 | 2024 |
| Union County | 24.8 | Soft | 873 | 153 | 2023 |
| Grant County | 22 | Soft | 1,366 | 283 | 2024 |
| Beauregard County | 21.8 | Soft | 912 | 152 | 2023 |
| Winn County | 20.9 | Soft | 614 | 145 | 2024 |
| Livingston County | 20 | Soft | 1,182 | 146 | 2024 |
| Claiborne County | 19 | Soft | 391 | 103 | 2026 |
| Bienville County | 18.9 | Soft | 708 | 227 | 2022 |
| East Baton Rouge County | 18 | Soft | 2,537 | 522 | 2024 |
| Tangipahoa County | 18 | Soft | 1,533 | 169 | 2024 |
| Allen County | 15 | Soft | 1,162 | 138 | 2024 |
| Lincoln County | 15 | Soft | 287 | 102 | 2023 |
| East Feliciana County | 14.2 | Soft | 311 | 98 | 2024 |
| Vernon County | 14 | Soft | 1,424 | 368 | 2024 |
| Jackson County | 13.2 | Soft | 270 | 91 | 2024 |
| Washington County | 13 | Soft | 1,138 | 104 | 2024 |
| St. Helena County | 6 | Soft | 92 | 44 | 2015 |
| 14 additional results from sites without county attribution (not shown). | |||||
ZIP codes
ZIP codes in Louisiana
The ZIP codes below are grouped by the Louisiana county each mostly falls within (by land area). Each ZIP takes that county's measured median — shown in the group header — so this is a ZIP-to-county guide, not a separate reading for every ZIP. To check the water system serving a specific address, use the lookup.
Key: a † after a ZIP means it has no mapped community water system — usually a private-well area. Plain ZIPs are served by a mapped community water system.
St. Bernard County · 500 mg/L · Very hard
7003270043700757008570092
Red River County · 260 mg/L · Very hard
71019†71034
Franklin County · 197 mg/L · Very hard
71219†71230†71243†71295†71336†71378†
Cameron County · 190 mg/L · Very hard
70630†70631†70632†70643†70645†
Orleans County · 190 mg/L · Very hard
701127011370114701157011670117701187011970122701247012570126701277012870129†7013070131701397014870163
Jefferson County · 165 mg/L · Hard
700017000270003700057000670036†700537005670058700627006570067†70072†70094701217012370358
Plaquemines County · 164 mg/L · Hard
70037†7003870040†70041†7005070082†70083†70091†
Terrebonne County · 154 mg/L · Hard
7034470352703537035670359703607036370364703777039570397
Bossier County · 150 mg/L · Hard
71006†7103771051†7106471067†7111071111†71112
Natchitoches County · 149.5 mg/L · Hard
710027106671070†71411†7141471416†71428†71434†71450†71452†71455†71456†7145771468†71469†71497
St. Charles County · 147 mg/L · Hard
70030†7003170039†7004770057†70070†700797008070087†
Iberia County · 143 mg/L · Hard
70513†70528†7054470552†70560†70563
Iberville County · 140 mg/L · Hard
7072170740†70757†70764†7077270776†70780†70788†
St. James County · 140 mg/L · Hard
70052†7007170086†70090†70723†70743†70763†
Vermilion County · 140 mg/L · Hard
70510†70533†70542†70548†70555†70575†
West Feliciana County · 140 mg/L · Hard
70712†70775†70782†70787†
Lafourche County · 132 mg/L · Hard
70301†7031070343†70345†70354†70355†70357†70373†70374†7037570394
Avoyelles County · 130 mg/L · Hard
71320†71322†71323†71327†71331†71333†71339†7134171350†71351†71355†71362†71369†
Madison County · 130 mg/L · Hard
71232†7123371282†
Pointe Coupee County · 130 mg/L · Hard
70715†70732†70736†70747†70749†70752†70753†70755†70756†7075970760†70762†70773†70783†
St. Mary County · 130 mg/L · Hard
7034070342†7039270514†70522†7052370538†
Assumption County · 114 mg/L · Moderately hard
70339†70341†70372†70380†70390†70391†70393†
Calcasieu County · 110 mg/L · Moderately hard
7060170605†70607†7060970611†70615†7062970633†706467064770661†70663†70665†70668†70669
Richland County · 110 mg/L · Moderately hard
71218†71259†71269†71279
West Baton Rouge County · 100 mg/L · Moderately hard
70710707197072970767
West Carroll County · 98 mg/L · Moderately hard
71237†712427125371263†71266†
St. Martin County · 97.2 mg/L · Moderately hard
70517†70519†70582†
St. Landry County · 96 mg/L · Moderately hard
7051270541†705507055170570†70577†70584†70589†70750†71345†71353†71356†71358†
Rapides County · 95 mg/L · Moderately hard
7130171302†71303†71325†71328†7133071346†7135971360†7140571409†71424†71427†7143071433†71447†71466†71472†71485†
Ascension County · 94 mg/L · Moderately hard
70346†70725†70734707377076970774†70778†
Acadia County · 92 mg/L · Moderately hard
70515†70516705257052670531†70534†70535†70537†705437055670559†70578
Caddo County · 91.7 mg/L · Moderately hard
71004†71007†7100971029†71033†71043†71044†71047†71060†7106171069†71082†7110171103711047110571106†71107†711087110971115†7111871119†71129†
Lafayette County · 87 mg/L · Moderately hard
7050170503†70506†70507†70508†70518†70520†70529†7055870583†70592†
East Carroll County · 84.8 mg/L · Moderately hard
71254†71276†71286†
Concordia County · 82.1 mg/L · Moderately hard
71316†71334†71354†71373†
St. John the Baptist County · 78 mg/L · Moderately hard
70049†70051†70068†70076†70084†
Tensas County · 71 mg/L · Moderately hard
71357†71366†71375†
Jefferson Davis County · 55.7 mg/L · Soft
70532†70546†70549†70581†705917064070650
Catahoula County · 52 mg/L · Soft
71326†71340†71343†71368†71401†71425†
De Soto County · 45 mg/L · Soft
71027†71030†71032†71046†71049†71052†71063†71078
Evangeline County · 44.2 mg/L · Soft
70524†70554†70576705807058570586†71367†
Morehouse County · 44 mg/L · Soft
71220†71223†71229†71250†7126171264†
Webster County · 36 mg/L · Soft
710187102171023†71024†7103971055†71071†71072†71073†71075†
St. Tammany County · 34 mg/L · Soft
70420†70431†7043370435†70437†70445†70447†7044870452†70457†704587046070461†7046370464†70471
Caldwell County · 33 mg/L · Soft
7141571418†71435†71441†
Sabine County · 28 mg/L · Soft
71065†71406†71419†71426†71429†71449†71462†71486
LaSalle County · 26 mg/L · Soft
71342†71371†71465†71480†
Ouachita County · 26 mg/L · Soft
712017120271203712097121271225†7129171292†
Union County · 24.8 mg/L · Soft
7122271234†71241†71256†71260†71277†71280†
Grant County · 22 mg/L · Soft
71407†71417†71423†71432†71454†71467†
Beauregard County · 21.8 mg/L · Soft
7063470652†70653†70657†70660†70662†
Winn County · 20.9 mg/L · Soft
71031†71404†714107142271473†71479†71483†
Livingston County · 20 mg/L · Soft
70449†70462†70706†7071170726†70733†70744†70754†70785†70786
Claiborne County · 19 mg/L · Soft
71003†71038†71040†71048†71079†
Bienville County · 18.9 mg/L · Soft
71001†71008†71016†71028†71045†71068†
East Baton Rouge County · 18 mg/L · Soft
7071470739†7077070791†708017080270803708057080670807708087080970810†708117081270813†70814708157081670817†708187081970820†7082570836
Tangipahoa County · 18 mg/L · Soft
704017040270403†7042270436†70442†70443†70444†70446†7045170454†70455†70456†7046570466†
Allen County · 15 mg/L · Soft
70637†70638†70644†70648†70651†70654†70655†70658†71463
Lincoln County · 15 mg/L · Soft
71227†71235†7124571270†7127271275†
East Feliciana County · 14.2 mg/L · Soft
70722†70730†70748†70761†70777†70789
Vernon County · 14 mg/L · Soft
70639†70656†7065971403†71438†71439†71446†71459†71461†71474†71475†
Jackson County · 13.2 mg/L · Soft
71226†71238†7124771251†71268†
Washington County · 13 mg/L · Soft
70426†70427†70438†70450†
St. Helena County · 6 mg/L · Soft
70441†70453†
† 358 ZIP codes are not served by a mapped community water system — most are private-well areas. See well water hardness.
Source
Groundwater vs surface water
Louisiana's groundwater measures harder than its surface water — 94 mg/L across 21,326 samples versus 89 across 59,822, about 1.1× harder. Wells draw from groundwater, so well owners in Louisiana tend to see the harder number — 94 mg/L, moderately hard. Groundwater readings there run 4 to 550 mg/L across the middle 80% of samples. The comparison draws on 10,102 groundwater and 2,278 surface-water monitoring sites; 2,806 readings above 2,000 mg/L were logged but held out of the medians as outliers.
Groundwater (wells)
94 mg/L as CaCO₃ · 21,326 results at 10,102 stations.
Surface water (rivers, lakes)
89 mg/L as CaCO₃ · 59,822 results at 2,278 stations.
Groundwater measures about 1.1× harder than surface water here.
Chemistry
Water chemistry in Louisiana
Beyond the hardness number, Louisiana's water carries a fuller chemical signature — here is how its measured parameters compare to national benchmarks.
TDS
185 mg/L · n=25,434
185 mg/L — below the national county median of 226.
pH
7.4 pH · n=18,362
pH 7.4 — within the EPA secondary range of 6.5–8.5, on the alkaline side.
Alkalinity
59.1 mg/L as CaCO3 · n=39,222
59.1 mg/L — modest buffering capacity.
Calcium : Magnesium
20.9 : 7.2 mg/L ≈ 2.9 : 1 · n=6,923
Calcium is about 64% of Louisiana's hardness (20.9 mg/L Ca to 7.2 mg/L Mg), a little more magnesium-rich than the national ~68% calcium share.
Parameter medians may include a small share of quality-control samples; the hardness lane is fully QC-filtered.
Aquifers
Major aquifers under Louisiana
3 aquifer systems supply much of Louisiana's measured groundwater.
- Alluvial aquifers — median 500 mg/L across 4,232 samples at 625 sites: very hard.
- Mississippi River Valley alluvial aquifer — median 260 mg/L across 1,947 samples at 1,122 sites: very hard.
- Coastal lowlands aquifer system — median 41 mg/L across 10,618 samples at 5,376 sites: soft.
Together these systems account for 16,797 measured samples at 7,123 sites. Aquifer medians pool samples across a whole system and can mask local variation — see the national aquifer map for how these compare across states.
Trend
Hardness over time
Louisiana's decade median moved from 110 mg/L in the 1900s to 80 in the 2020s. Over the series, the decade median peaked at 137 mg/L in the 1990s and bottomed at 42 in the 1930s. Decade medians reflect where and what agencies sampled in each era, not just changes in the water itself.
Scale
Where Louisiana sits on the scale
On the USGS scale, Louisiana's 90 mg/L is moderately hard — 5.3 grains per gallon, between the 60 and 120 mg/L soft and hard cutoffs.
Questions
Frequently asked questions
- Is Louisiana's water hard?
- Louisiana's median hardness is 90 mg/L as CaCO₃, "moderately hard" on the USGS scale and below the national county median of 140 mg/L.
- Which county in Louisiana has the hardest water?
- St. Bernard County, with a median of 500 mg/L as CaCO₃ across 1,325 measurements.
- Is well water harder than city water in Louisiana?
- Groundwater measures harder here — about 1.1× the surface water — so wells tend to run harder (groundwater 94 vs surface water 89 mg/L).
- How do I find my exact hardness in Louisiana?
- Search your ZIP on the lookup tool, read your utility's Consumer Confidence Report, or test at home with a kit.
- Is Louisiana's water harder than the national average?
- No. Louisiana's median of 90 mg/L is below the national county median of 140 mg/L; it ranks #27 of the 50 states and D.C.
Compare
States with similar hardness
Two states measure closest to Louisiana's 90 mg/L: Pennsylvania at 83 mg/L and Tennessee at 82.9 mg/L. Louisiana measures harder than 48% of states. Browse the full ranking on the statistics page.
More: hardness scale · check your address · national statistics · the national map.
By Marko Visic, MPharm, BSc Physics. Source: USGS/EPA Water Quality Portal — 81,193 Louisiana measurements. Data last verified . Methodology.
Cite this page: “Louisiana Water Hardness by County.” Hard Water Map. Retrieved 2026-07-22, https://hardwatermap.com/water-hardness/louisiana/