Tennessee Water Hardness by County
Water in Tennessee has a median hardness of 82.9 mg/L as CaCO₃ — "moderately hard" on the USGS scale — based on 47,207 measurements at 6,452 monitoring stations. Greene County has the state's hardest measured water (246 mg/L); Blount County the softest (8.8). Rank: #29 of the 50 states and D.C.
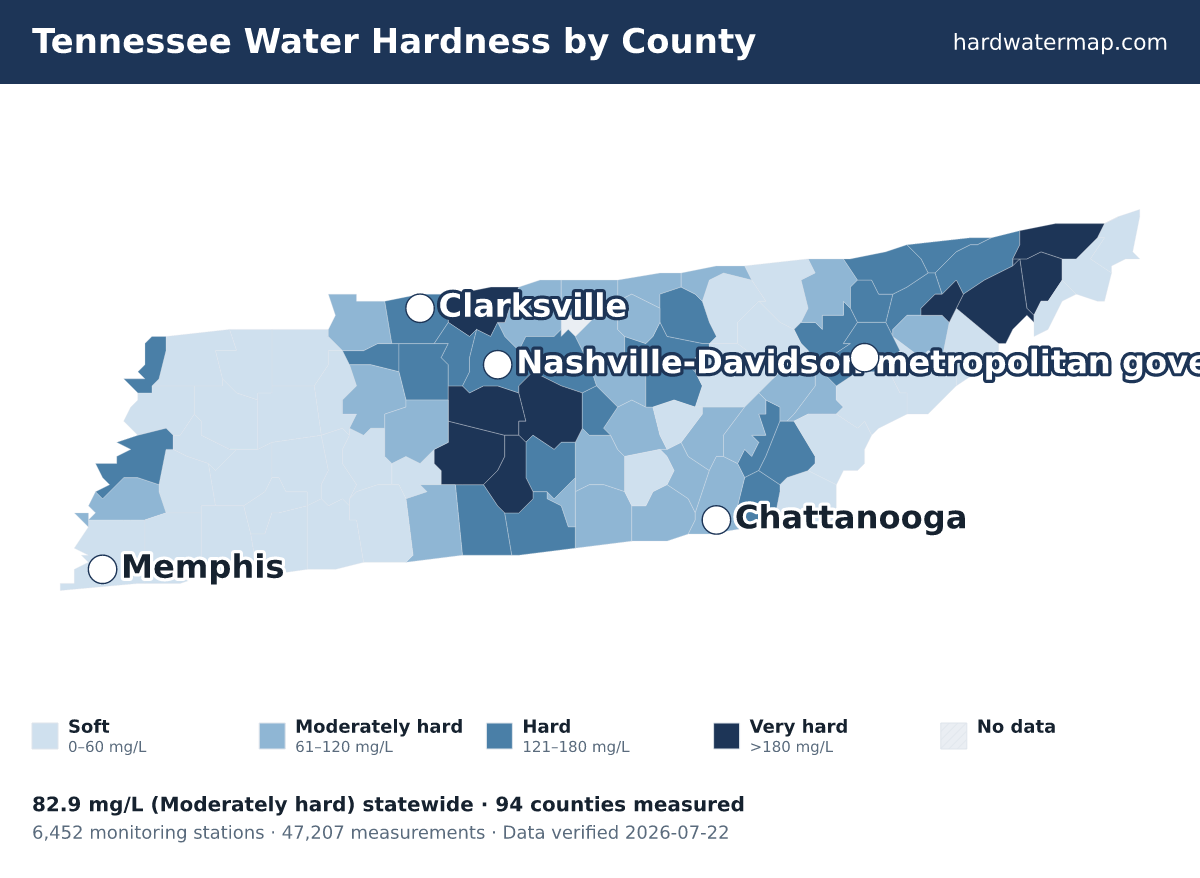
Tennessee water hardness map — what the numbers mean. Data verified 2026-07-22.
Of Tennessee's 94 measured counties, 9 very hard, 25 hard, 25 moderately hard, and 35 soft. The hardest are Greene County (246 mg/L), Washington County (246), and Hamblen County (230.5). Blount County is the softest at 8.8 mg/L (soft).
About 52% of Tennessee's roughly 7 million residents in counties with gate-passing hardness data live where tap water is hard or worse.
Statewide, Tennessee's median works out to 4.8 grains per gallon and ranks #29 of the 50 states and D.C. Across 47,207 measurements at 6,452 stations — 32,931 of them since 2000 — the middle 80% of readings fall between 13 and 221 mg/L. The public record runs from 1907 to 2025.
See where Tennessee sits nationally on the national map, or what its number means on the hardness scale.
Download the Tennessee water hardness map (PNG) — Water hardness by county in Tennessee: 94 counties mapped from USGS/EPA data, statewide median 82.9 mg/L (moderately hard); darker counties have harder water.
By county
Water hardness by county
The table lists all 94 measured Tennessee counties, hardest first. Their medians span 246 mg/L in Greene County to 8.8 in Blount County — a 28× range. 1 more Tennessee county lacks gate-passing data.
| County | Median | Band | Results | Sites | Newest |
|---|---|---|---|---|---|
| Greene County | 246 | Very hard | 771 | 72 | 2019 |
| Washington County | 246 | Very hard | 761 | 69 | 2019 |
| Hamblen County | 230.5 | Very hard | 36 | 13 | 2016 |
| Sullivan County | 220 | Very hard | 1,015 | 150 | 2019 |
| Marshall County | 208 | Very hard | 152 | 47 | 2016 |
| Williamson County | 200 | Very hard | 510 | 106 | 2017 |
| Robertson County | 198 | Very hard | 241 | 39 | 2018 |
| Rutherford County | 192 | Very hard | 1,332 | 158 | 2018 |
| Maury County | 180 | Very hard | 447 | 73 | 2019 |
| Grainger County | 176 | Hard | 79 | 44 | 2015 |
| Wilson County | 170 | Hard | 484 | 97 | 2018 |
| Hancock County | 167 | Hard | 350 | 47 | 2019 |
| Union County | 163.5 | Hard | 82 | 17 | 2022 |
| Davidson County | 160 | Hard | 1,219 | 90 | 2023 |
| Lincoln County | 159 | Hard | 175 | 51 | 2022 |
| Lauderdale County | 157 | Hard | 337 | 64 | 2017 |
| Cannon County | 156 | Hard | 202 | 69 | 2019 |
| McMinn County | 155 | Hard | 384 | 44 | 2022 |
| Bradley County | 154 | Hard | 308 | 55 | 2017 |
| Dickson County | 153 | Hard | 393 | 45 | 2023 |
| Houston County | 150 | Hard | 61 | 8 | 2012 |
| Montgomery County | 148 | Hard | 597 | 45 | 2023 |
| Putnam County | 144 | Hard | 473 | 163 | 2020 |
| Anderson County | 140 | Hard | 893 | 131 | 2022 |
| Overton County | 140 | Hard | 353 | 29 | 2016 |
| Bedford County | 130 | Hard | 379 | 84 | 2019 |
| Cheatham County | 130 | Hard | 544 | 29 | 2023 |
| Claiborne County | 130 | Hard | 1,143 | 56 | 2019 |
| White County | 130 | Hard | 243 | 113 | 2020 |
| Giles County | 125 | Hard | 275 | 28 | 2025 |
| Hawkins County | 120 | Hard | 632 | 72 | 2022 |
| Knox County | 120 | Hard | 877 | 60 | 2019 |
| Lake County | 120 | Hard | 61 | 28 | 2019 |
| Meigs County | 120 | Hard | 173 | 27 | 2018 |
| Stewart County | 115.5 | Moderately hard | 196 | 15 | 2023 |
| Warren County | 114 | Moderately hard | 355 | 52 | 2019 |
| Sequatchie County | 110 | Moderately hard | 179 | 37 | 2019 |
| Campbell County | 105 | Moderately hard | 402 | 59 | 2019 |
| Macon County | 105 | Moderately hard | 71 | 15 | 2015 |
| Hickman County | 99.7 | Moderately hard | 152 | 40 | 2014 |
| Jefferson County | 99.5 | Moderately hard | 54 | 12 | 2022 |
| Pickett County | 99.2 | Moderately hard | 384 | 15 | 2016 |
| Humphreys County | 99 | Moderately hard | 206 | 51 | 2019 |
| Sumner County | 97 | Moderately hard | 386 | 32 | 2015 |
| Jackson County | 94.4 | Moderately hard | 304 | 17 | 2020 |
| Clay County | 94 | Moderately hard | 518 | 18 | 2019 |
| Roane County | 88 | Moderately hard | 1,004 | 118 | 2019 |
| Smith County | 86.7 | Moderately hard | 696 | 85 | 2020 |
| DeKalb County | 83.3 | Moderately hard | 2,085 | 164 | 2020 |
| Franklin County | 82.2 | Moderately hard | 330 | 90 | 2022 |
| Bledsoe County | 78 | Moderately hard | 255 | 59 | 2019 |
| Loudon County | 78 | Moderately hard | 522 | 20 | 2017 |
| Hamilton County | 74 | Moderately hard | 1,055 | 175 | 2022 |
| Marion County | 74 | Moderately hard | 633 | 77 | 2025 |
| Coffee County | 73 | Moderately hard | 405 | 295 | 2022 |
| Rhea County | 68 | Moderately hard | 470 | 72 | 2022 |
| Lawrence County | 65 | Moderately hard | 203 | 25 | 2024 |
| Moore County | 64.2 | Moderately hard | 38 | 14 | 2018 |
| Tipton County | 61 | Moderately hard | 466 | 65 | 2019 |
| Grundy County | 58.5 | Soft | 176 | 39 | 2019 |
| Shelby County | 51 | Soft | 4,669 | 574 | 2023 |
| Hardin County | 48 | Soft | 367 | 48 | 2019 |
| Johnson County | 47 | Soft | 525 | 77 | 2018 |
| Wayne County | 45.5 | Soft | 142 | 47 | 2019 |
| Crockett County | 45 | Soft | 91 | 29 | 2019 |
| Van Buren County | 41 | Soft | 116 | 21 | 2018 |
| Perry County | 40.8 | Soft | 251 | 7 | 2013 |
| Fentress County | 40 | Soft | 355 | 40 | 2016 |
| Sevier County | 40 | Soft | 222 | 43 | 2019 |
| Scott County | 38.7 | Soft | 1,486 | 81 | 2019 |
| Carter County | 38 | Soft | 492 | 61 | 2019 |
| Dyer County | 38 | Soft | 306 | 66 | 2019 |
| Cocke County | 32 | Soft | 610 | 33 | 2025 |
| Decatur County | 31.1 | Soft | 98 | 24 | 2019 |
| Lewis County | 30.8 | Soft | 107 | 21 | 2019 |
| Cumberland County | 26 | Soft | 889 | 69 | 2019 |
| Obion County | 26 | Soft | 563 | 75 | 2019 |
| Henry County | 24 | Soft | 277 | 91 | 2022 |
| Monroe County | 23 | Soft | 263 | 42 | 2022 |
| McNairy County | 21 | Soft | 265 | 67 | 2019 |
| Morgan County | 21 | Soft | 1,513 | 103 | 2019 |
| Polk County | 20.4 | Soft | 1,022 | 127 | 2022 |
| Hardeman County | 20 | Soft | 326 | 64 | 2022 |
| Gibson County | 19.8 | Soft | 227 | 59 | 2022 |
| Benton County | 19 | Soft | 174 | 25 | 2019 |
| Unicoi County | 19 | Soft | 158 | 17 | 2022 |
| Haywood County | 18 | Soft | 375 | 50 | 2019 |
| Madison County | 18 | Soft | 518 | 149 | 2022 |
| Weakley County | 18 | Soft | 313 | 95 | 2019 |
| Fayette County | 17 | Soft | 1,237 | 118 | 2022 |
| Carroll County | 15.1 | Soft | 360 | 79 | 2022 |
| Henderson County | 15 | Soft | 342 | 60 | 2019 |
| Chester County | 13 | Soft | 91 | 23 | 2017 |
| Blount County | 8.8 | Soft | 927 | 80 | 2023 |
ZIP codes
ZIP codes in Tennessee
The ZIP codes below are grouped by the Tennessee county each mostly falls within (by land area). Each ZIP takes that county's measured median — shown in the group header — so this is a ZIP-to-county guide, not a separate reading for every ZIP. To check the water system serving a specific address, use the lookup.
Key: a † after a ZIP means it has no mapped community water system — usually a private-well area. Plain ZIPs are served by a mapped community water system.
Greene County · 246 mg/L · Very hard
37616376413774337745378093781037818
Washington County · 246 mg/L · Very hard
3760137604376143761537656376593768137690
Hamblen County · 230.5 mg/L · Very hard
3781337814†3786037891
Sullivan County · 220 mg/L · Very hard
3761737618376203766037663376643766537686†
Marshall County · 208 mg/L · Very hard
370193703437047†37091
Williamson County · 200 mg/L · Very hard
37014370273704637062370643706737069371353717938476†
Robertson County · 198 mg/L · Very hard
3701037032370493707337141371463717237188
Rutherford County · 192 mg/L · Very hard
37037370603708537086371183712737128371293713037132371493715337167
Maury County · 180 mg/L · Very hard
371743840138451384743848238487
Grainger County · 176 mg/L · Hard
37708377093784837861†37881†37888
Wilson County · 170 mg/L · Hard
37016370873709037122†37184
Hancock County · 167 mg/L · Hard
37765†37869
Union County · 163.5 mg/L · Hard
377793780737866†
Davidson County · 160 mg/L · Hard
370133707237076370803711537138†371893720137203372043720537206372073720837209372103721137212372133721437215372163721737218372193722037221372283723237238
Lincoln County · 159 mg/L · Hard
37144†373283733437335373483735938449384533845938488
Lauderdale County · 157 mg/L · Hard
3804038041†38063
Cannon County · 156 mg/L · Hard
3702637190†
McMinn County · 155 mg/L · Hard
3730337309†37329†3733137370†37826
Bradley County · 154 mg/L · Hard
3731037311373123732337353
Dickson County · 153 mg/L · Hard
370293703637051†370553716537181†37187
Houston County · 150 mg/L · Hard
370613717537178
Montgomery County · 148 mg/L · Hard
3704037042370433705237142371713719142223†
Putnam County · 144 mg/L · Hard
38501†38503385053850638544†3854838574†38582
Anderson County · 140 mg/L · Hard
3770537710†3771637754377693782837830†
Overton County · 140 mg/L · Hard
3854138542†38543†3855438568†3857038573†38580
Bedford County · 130 mg/L · Hard
37020†371603718037183†37360
Cheatham County · 130 mg/L · Hard
37015370353708237143
Claiborne County · 130 mg/L · Hard
37715†3772437730†37752†3782537851†37870†37879†
White County · 130 mg/L · Hard
385793858338587
Giles County · 125 mg/L · Hard
3845538460384723847338477†38478
Hawkins County · 120 mg/L · Hard
37642376453771137731378113785737873
Knox County · 120 mg/L · Hard
3772137806†378493787137902379093791237914379153791637917379183791937920379213792237923379243792937931379323793437938
Lake County · 120 mg/L · Hard
380773807938080†
Meigs County · 120 mg/L · Hard
37322†37880
Stewart County · 115.5 mg/L · Moderately hard
3702337028†370503705837079†
Warren County · 114 mg/L · Moderately hard
37110†37357373943855038581
Sequatchie County · 110 mg/L · Moderately hard
37327†
Campbell County · 105 mg/L · Moderately hard
37714†37729†37757†377623776637819†37847†
Macon County · 105 mg/L · Moderately hard
3708337150
Hickman County · 99.7 mg/L · Moderately hard
3702537033†370983713737140†38454†
Jefferson County · 99.5 mg/L · Moderately hard
37725†37760†378203787737890†
Pickett County · 99.2 mg/L · Moderately hard
3854938577†
Humphreys County · 99 mg/L · Moderately hard
3707837101†3713437185†
Sumner County · 97 mg/L · Moderately hard
37022370313704837066370753714837186
Jackson County · 94.4 mg/L · Moderately hard
38545385623856438588
Clay County · 94 mg/L · Moderately hard
3855138575
Roane County · 88 mg/L · Moderately hard
37748†37763†37854†
Smith County · 86.7 mg/L · Moderately hard
37030†3714537151†385473855238560385633856738569
DeKalb County · 83.3 mg/L · Moderately hard
37012370593709537166
Franklin County · 82.2 mg/L · Moderately hard
373063731837324†37330373453737537376†3738337398
Bledsoe County · 78 mg/L · Moderately hard
3733837367
Loudon County · 78 mg/L · Moderately hard
377423777137772†3777437846†
Hamilton County · 74 mg/L · Moderately hard
3730237308373153733637341†373433735037351373633737337377373793740237403374043740637407374083740937410374113741237415374163742137450
Marion County · 74 mg/L · Moderately hard
37340373473735637374†37380†37396†3739737405†37419
Coffee County · 73 mg/L · Moderately hard
37018373423735537388†
Rhea County · 68 mg/L · Moderately hard
37321373323733737381†
Lawrence County · 65 mg/L · Moderately hard
3845638457384643846838469384813848338486†
Moore County · 64.2 mg/L · Moderately hard
37352
Tipton County · 61 mg/L · Moderately hard
38004380113801538019380233805872338
Grundy County · 58.5 mg/L · Soft
3730137305373133733937365†37366†37387
Shelby County · 51 mg/L · Soft
3800238016380173801838029380533805438103381043810538106381073810838109381113811238113381143811538116381173811838119381203812238125381263812738128381313813238133381343813538138381393814138152
Hardin County · 48 mg/L · Soft
3832638327383593836138365383703837238376†38475†
Johnson County · 47 mg/L · Soft
37640†37680†37683†37688†37691†
Wayne County · 45.5 mg/L · Soft
38425†38450†38452†38463†38471†38485
Crockett County · 45 mg/L · Soft
3800138021†380343805038337
Van Buren County · 41 mg/L · Soft
3855938585†
Perry County · 40.8 mg/L · Soft
3709637097†
Fentress County · 40 mg/L · Soft
3850438553†38556†38565†38589†
Sevier County · 40 mg/L · Soft
37738†37764†37862378633786537876
Scott County · 38.7 mg/L · Soft
37732†3775537756†378413785237892†
Carter County · 38 mg/L · Soft
3764337658†3768237687†37694†
Dyer County · 38 mg/L · Soft
380073802438030†38047†3805938070
Cocke County · 32 mg/L · Soft
377133772237727377533782137843†
Decatur County · 31.1 mg/L · Soft
3831138329383633837438380†
Lewis County · 30.8 mg/L · Soft
38461†38462
Cumberland County · 26 mg/L · Soft
3772338555†3855838571†3857238578
Obion County · 26 mg/L · Soft
38232†3824038253†38254†38257382593826038261
Henry County · 24 mg/L · Soft
38222†3822438231†38236†3824238251†38256
Monroe County · 23 mg/L · Soft
3735437385†3787437885†
McNairy County · 21 mg/L · Soft
3806138310383153833438339†38357†38367†3837538379
Morgan County · 21 mg/L · Soft
3771937726†37733†37770†3782937840†37845†37872†37887
Polk County · 20.4 mg/L · Soft
373073731637317†373253732637333†373613736237369†37391
Hardeman County · 20 mg/L · Soft
38008†3803938042†38044†38052†38067†38075†38381
Gibson County · 19.8 mg/L · Soft
38233†383163833038338383433835838369†3838238389
Benton County · 19 mg/L · Soft
38221†3832038333†38341
Unicoi County · 19 mg/L · Soft
3765037657†37692†
Haywood County · 18 mg/L · Soft
38006†380123803738069
Madison County · 18 mg/L · Soft
38301†3830538313†38355†38356†38362†38366†38391†38392†
Weakley County · 18 mg/L · Soft
38225†38226†3822938230†3823738241†38255†
Fayette County · 17 mg/L · Soft
38028†380363804638049†38057†3806038066†3806838076†
Carroll County · 15.1 mg/L · Soft
3820138220†38235382583831738318†38321†38342†383443834838387†38390†
Henderson County · 15 mg/L · Soft
3832838345†38351383683837138388†
Chester County · 13 mg/L · Soft
38332†3834038347†38352†
Blount County · 8.8 mg/L · Soft
377013773737777378013780337804†3785337878†37882†37886†
† 178 ZIP codes are not served by a mapped community water system — most are private-well areas. See well water hardness.
Source
Groundwater vs surface water
Tennessee's surface water measures harder than its groundwater — 83 mg/L across 43,611 samples versus 77 across 3,471, about 1.1× harder. For well owners that is the better side of a hard bargain: at 77 mg/L, Tennessee groundwater is still moderately hard, and most of the state's drinking water is pumped from it. Groundwater readings there run 14.8 to 308 mg/L across the middle 80% of samples. The comparison draws on 2,354 groundwater and 4,087 surface-water monitoring sites; 21 readings above 2,000 mg/L were logged but held out of the medians as outliers.
Groundwater (wells)
77 mg/L as CaCO₃ · 3,471 results at 2,354 stations.
Surface water (rivers, lakes)
83 mg/L as CaCO₃ · 43,611 results at 4,087 stations.
Surface water measures about 1.1× harder than groundwater here.
Chemistry
Water chemistry in Tennessee
Beyond the hardness number, Tennessee's water carries a fuller chemical signature — here is how its measured parameters compare to national benchmarks.
TDS
119 mg/L · n=14,913
119 mg/L — below the national county median of 226.
pH
7.5 pH · n=22,800
pH 7.5 — within the EPA secondary range of 6.5–8.5, on the alkaline side.
Alkalinity
76 mg/L as CaCO3 · n=19,563
76 mg/L — modest buffering capacity.
Calcium : Magnesium
26.6 : 4.9 mg/L ≈ 5.43 : 1 · n=16,280
Calcium is about 77% of Tennessee's hardness (26.6 mg/L Ca to 4.9 mg/L Mg), a little more calcium-rich than the national ~68% calcium share.
Parameter medians may include a small share of quality-control samples; the hardness lane is fully QC-filtered.
Aquifers
Major aquifers under Tennessee
3 aquifer systems supply much of Tennessee's measured groundwater.
- Mississippi River Valley alluvial aquifer — median 359 mg/L across 28 samples at 13 sites: very hard.
- Ordovician aquifers — median 230 mg/L across 215 samples at 161 sites: very hard.
- Alluvial aquifers — median 180 mg/L across 195 samples at 133 sites: very hard.
Together these systems account for 438 measured samples at 307 sites. Aquifer medians pool samples across a whole system and can mask local variation — see the national aquifer map for how these compare across states.
Trend
Hardness over time
Tennessee's decade median moved from 40 mg/L in the 1920s to 73.8 in the 2020s. Over the series, the decade median peaked at 96 mg/L in the 1960s and bottomed at 40 in the 1920s. Decade medians reflect where and what agencies sampled in each era, not just changes in the water itself.
Scale
Where Tennessee sits on the scale
On the USGS scale, Tennessee's 82.9 mg/L is moderately hard — 4.8 grains per gallon, between the 60 and 120 mg/L soft and hard cutoffs.
Questions
Frequently asked questions
- Is Tennessee's water hard?
- Tennessee's median hardness is 82.9 mg/L as CaCO₃, "moderately hard" on the USGS scale and below the national county median of 140 mg/L. About 52% of residents in measured counties have hard-or-worse water.
- Which county in Tennessee has the hardest water?
- Greene County, with a median of 246 mg/L as CaCO₃ across 771 measurements.
- Is well water harder than city water in Tennessee?
- Surface water measures harder here — about 1.1× the groundwater — so wells tend to run softer (groundwater 77 vs surface water 83 mg/L).
- How do I find my exact hardness in Tennessee?
- Search your ZIP on the lookup tool, read your utility's Consumer Confidence Report, or test at home with a kit.
- Is Tennessee's water harder than the national average?
- No. Tennessee's median of 82.9 mg/L is below the national county median of 140 mg/L; it ranks #29 of the 50 states and D.C.
Compare
States with similar hardness
Two states measure closest to Tennessee's 82.9 mg/L: Pennsylvania at 83 mg/L and West Virginia at 81 mg/L. Tennessee measures harder than 44% of states. Browse the full ranking on the statistics page.
More: hardness scale · check your address · national statistics · the national map.
By Marko Visic, MPharm, BSc Physics. Source: USGS/EPA Water Quality Portal — 47,207 Tennessee measurements. Data last verified . Methodology.
Cite this page: “Tennessee Water Hardness by County.” Hard Water Map. Retrieved 2026-07-22, https://hardwatermap.com/water-hardness/tennessee/