Minnesota Water Hardness by County
Water in Minnesota has a median hardness of 140 mg/L as CaCO₃ — "hard" on the USGS scale — based on 62,159 measurements at 7,816 monitoring stations. Lyon County has the state's hardest measured water (565.5 mg/L); Cook County the softest (19). Rank: #22 of the 50 states and D.C.
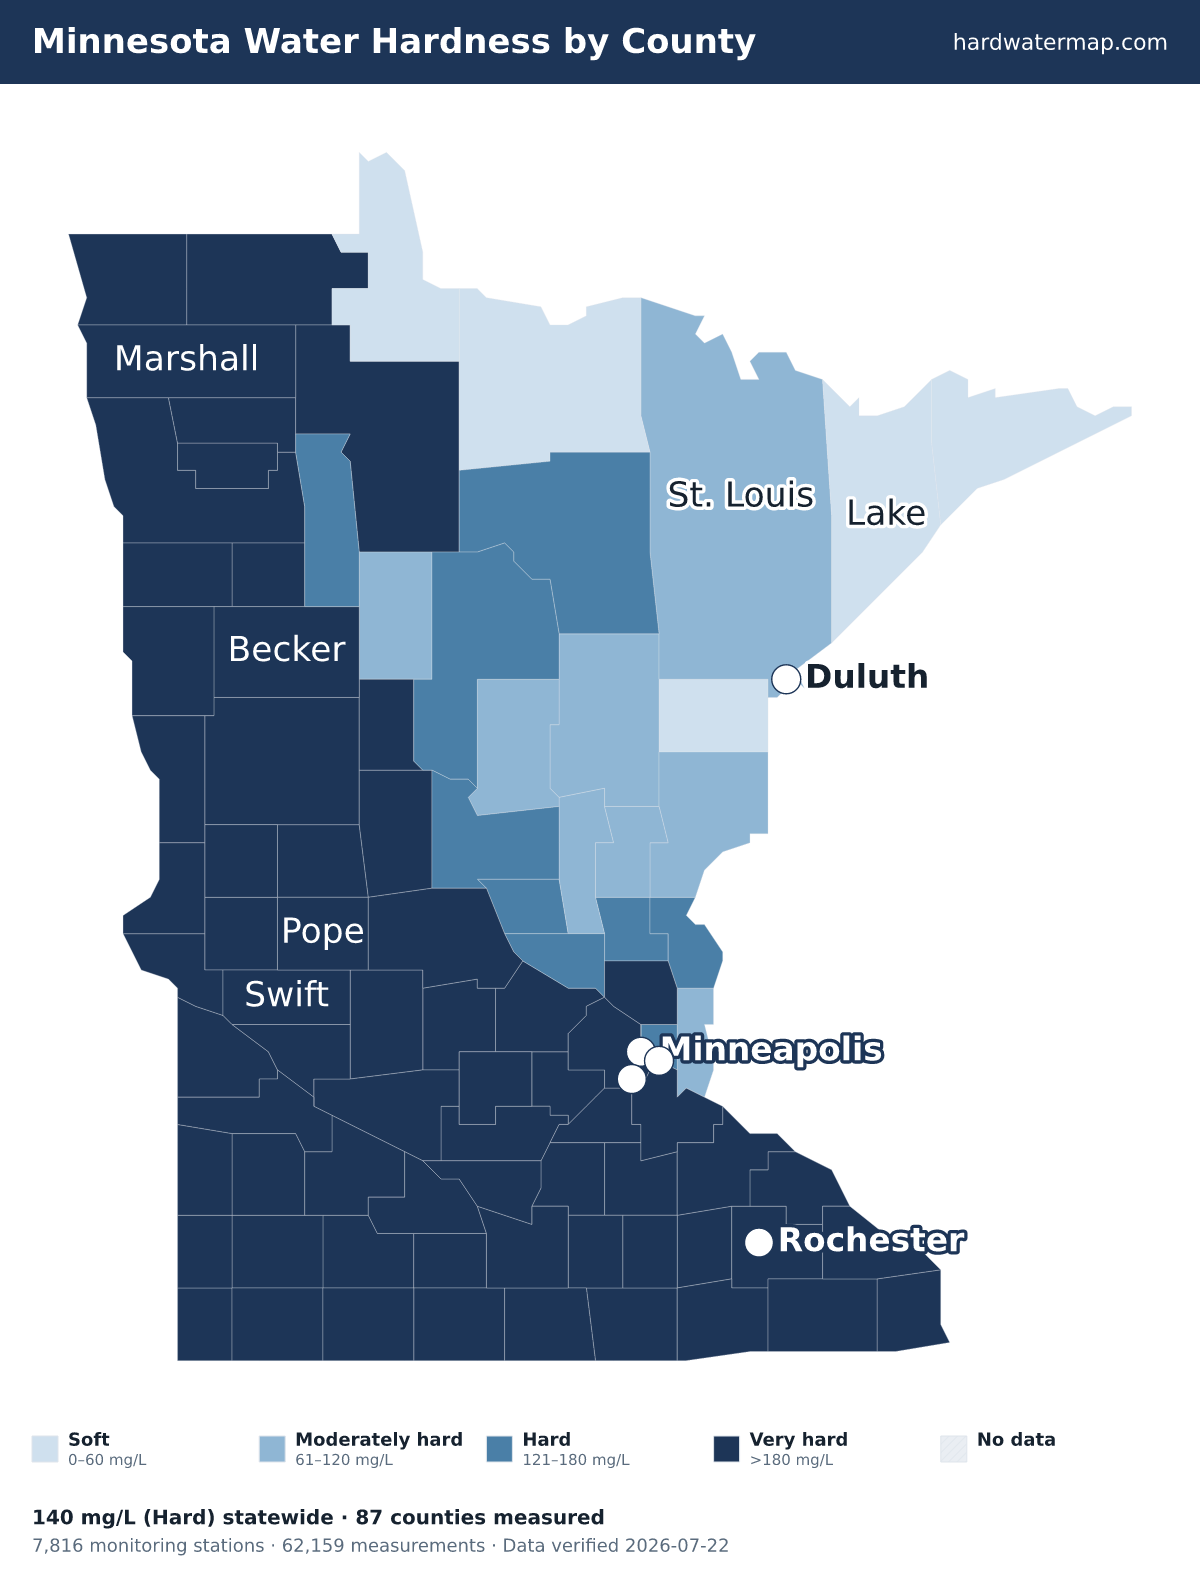
Minnesota water hardness map — what the numbers mean. Data verified 2026-07-22.
Of Minnesota's 87 measured counties, 65 very hard, 9 hard, 8 moderately hard, and 5 soft. The hardest are Lyon County (565.5 mg/L), Redwood County (560), and Lac qui Parle County (541). Cook County is the softest at 19 mg/L (soft).
About 87% of Minnesota's roughly 5.7 million residents in counties with gate-passing hardness data live where tap water is hard or worse.
Statewide, Minnesota's median works out to 8.2 grains per gallon and ranks #22 of the 50 states and D.C. Across 62,159 measurements at 7,816 stations — 20,151 of them since 2000 — the middle 80% of readings fall between 35 and 382 mg/L. The public record runs from 1932 to 2025.
See where Minnesota sits nationally on the national map, or what its number means on the hardness scale.
Download the Minnesota water hardness map (PNG) — Water hardness by county in Minnesota: 87 counties mapped from USGS/EPA data, statewide median 140 mg/L (hard); darker counties have harder water.
By county
Water hardness by county
The table lists all 87 measured Minnesota counties, hardest first. Their medians span 565.5 mg/L in Lyon County to 19 in Cook County — a 29.8× range.
| County | Median | Band | Results | Sites | Newest |
|---|---|---|---|---|---|
| Lyon County | 565.5 | Very hard | 148 | 64 | 2025 |
| Redwood County | 560 | Very hard | 410 | 110 | 2025 |
| Lac qui Parle County | 541 | Very hard | 198 | 24 | 2023 |
| Grant County | 540 | Very hard | 57 | 47 | 2023 |
| Nobles County | 505.5 | Very hard | 80 | 57 | 2023 |
| Yellow Medicine County | 500 | Very hard | 436 | 68 | 2025 |
| Lincoln County | 493 | Very hard | 96 | 39 | 2025 |
| Renville County | 490 | Very hard | 274 | 55 | 2025 |
| Brown County | 480 | Very hard | 307 | 25 | 2025 |
| Nicollet County | 440 | Very hard | 264 | 35 | 2025 |
| Traverse County | 435 | Very hard | 56 | 37 | 2023 |
| Big Stone County | 430 | Very hard | 162 | 46 | 2023 |
| Swift County | 425 | Very hard | 194 | 48 | 2025 |
| Jackson County | 420 | Very hard | 321 | 38 | 2023 |
| Stevens County | 420 | Very hard | 33 | 24 | 2023 |
| Chippewa County | 410 | Very hard | 283 | 23 | 2025 |
| McLeod County | 405 | Very hard | 142 | 48 | 2025 |
| Carver County | 400 | Very hard | 450 | 44 | 2025 |
| Murray County | 390 | Very hard | 78 | 32 | 2025 |
| Sibley County | 390 | Very hard | 132 | 31 | 2025 |
| Le Sueur County | 380 | Very hard | 251 | 46 | 2025 |
| Pipestone County | 375 | Very hard | 360 | 51 | 2023 |
| Faribault County | 367.5 | Very hard | 638 | 54 | 2019 |
| Cottonwood County | 363 | Very hard | 110 | 48 | 2025 |
| Scott County | 362.5 | Very hard | 294 | 82 | 2025 |
| Blue Earth County | 360 | Very hard | 894 | 79 | 2025 |
| Martin County | 352 | Very hard | 241 | 33 | 2025 |
| Clay County | 350 | Very hard | 436 | 70 | 2025 |
| Rock County | 350 | Very hard | 132 | 54 | 2023 |
| Steele County | 340 | Very hard | 79 | 24 | 2023 |
| Waseca County | 335 | Very hard | 62 | 20 | 2022 |
| Rice County | 324.5 | Very hard | 106 | 43 | 2025 |
| Meeker County | 320 | Very hard | 427 | 50 | 2023 |
| Watonwan County | 320 | Very hard | 73 | 43 | 2025 |
| Pope County | 313 | Very hard | 135 | 90 | 2022 |
| Olmsted County | 303.5 | Very hard | 282 | 102 | 2024 |
| Dodge County | 300 | Very hard | 17 | 15 | 2024 |
| Norman County | 300 | Very hard | 441 | 39 | 2025 |
| Fillmore County | 293 | Very hard | 158 | 61 | 2015 |
| Red Lake County | 288 | Very hard | 90 | 32 | 2025 |
| Freeborn County | 280 | Very hard | 319 | 47 | 2023 |
| Houston County | 280 | Very hard | 308 | 31 | 2024 |
| Marshall County | 280 | Very hard | 369 | 98 | 2024 |
| Wabasha County | 270 | Very hard | 186 | 41 | 2024 |
| Mower County | 268 | Very hard | 410 | 54 | 2023 |
| Kittson County | 260 | Very hard | 410 | 69 | 2024 |
| Dakota County | 252 | Very hard | 1,275 | 262 | 2025 |
| Kandiyohi County | 250 | Very hard | 146 | 65 | 2023 |
| Stearns County | 250 | Very hard | 682 | 158 | 2025 |
| Wadena County | 250 | Very hard | 184 | 101 | 2023 |
| Goodhue County | 240 | Very hard | 505 | 100 | 2025 |
| Polk County | 240 | Very hard | 684 | 161 | 2025 |
| Wilkin County | 240 | Very hard | 310 | 50 | 2023 |
| Wright County | 240 | Very hard | 1,016 | 75 | 2023 |
| Otter Tail County | 233 | Very hard | 439 | 220 | 2023 |
| Mahnomen County | 230 | Very hard | 92 | 36 | 2025 |
| Roseau County | 230 | Very hard | 156 | 50 | 2024 |
| Winona County | 230 | Very hard | 751 | 49 | 2025 |
| Pennington County | 228.5 | Very hard | 27 | 20 | 2024 |
| Hennepin County | 220 | Very hard | 2,662 | 405 | 2025 |
| Todd County | 220 | Very hard | 121 | 71 | 2025 |
| Becker County | 212 | Very hard | 223 | 115 | 2022 |
| Douglas County | 207 | Very hard | 129 | 66 | 2025 |
| Anoka County | 186 | Very hard | 2,298 | 165 | 2025 |
| Beltrami County | 183 | Very hard | 361 | 116 | 2025 |
| Sherburne County | 171 | Hard | 443 | 128 | 2024 |
| Clearwater County | 170 | Hard | 256 | 72 | 2025 |
| Chisago County | 160 | Hard | 282 | 47 | 2025 |
| Isanti County | 150 | Hard | 90 | 37 | 2020 |
| Morrison County | 149 | Hard | 934 | 104 | 2024 |
| Benton County | 147.5 | Hard | 166 | 23 | 2024 |
| Cass County | 135 | Hard | 456 | 132 | 2025 |
| Ramsey County | 123 | Hard | 16,050 | 175 | 2025 |
| Itasca County | 120 | Hard | 900 | 257 | 2025 |
| Aitkin County | 110 | Moderately hard | 414 | 112 | 2024 |
| Washington County | 105 | Moderately hard | 2,105 | 159 | 2025 |
| Hubbard County | 100.5 | Moderately hard | 676 | 141 | 2025 |
| Crow Wing County | 100 | Moderately hard | 398 | 118 | 2025 |
| Mille Lacs County | 100 | Moderately hard | 115 | 65 | 2025 |
| Kanabec County | 78 | Moderately hard | 92 | 43 | 2023 |
| Pine County | 64 | Moderately hard | 670 | 122 | 2023 |
| St. Louis County | 62 | Moderately hard | 6,510 | 697 | 2025 |
| Carlton County | 59.3 | Soft | 3,488 | 146 | 2023 |
| Lake of the Woods County | 49 | Soft | 287 | 41 | 2024 |
| Koochiching County | 44 | Soft | 910 | 80 | 2025 |
| Lake County | 21 | Soft | 2,343 | 324 | 2025 |
| Cook County | 19 | Soft | 1,164 | 237 | 2025 |
ZIP codes
ZIP codes in Minnesota
The ZIP codes below are grouped by the Minnesota county each mostly falls within (by land area). Each ZIP takes that county's measured median — shown in the group header — so this is a ZIP-to-county guide, not a separate reading for every ZIP. To check the water system serving a specific address, use the lookup.
Key: a † after a ZIP means it has no mapped community water system — usually a private-well area. Plain ZIPs are served by a mapped community water system.
Lyon County · 565.5 mg/L · Very hard
56115†56132†56157†56169†5617556229†56239†56258†56264
Redwood County · 560 mg/L · Very hard
5608356152†56166†56180†5621456224†56255†56263†56266†56283†5628756292†56293†56294†
Lac qui Parle County · 541 mg/L · Very hard
56212†56218†56232†56256†56257†
Grant County · 540 mg/L · Very hard
56248†56274†56309†56311†56339†56531†56590†
Nobles County · 505.5 mg/L · Very hard
56110†56117†56119†561295615356155†56165†5616856185†56187†
Yellow Medicine County · 500 mg/L · Very hard
56220†56223†56237†56241†56245†56291†56297†
Lincoln County · 493 mg/L · Very hard
56113†56136†56142†56149†56178†56280
Renville County · 490 mg/L · Very hard
55310†55314†55332†55333†55342†5623056270†5627756284†56285
Brown County · 480 mg/L · Very hard
56019†56030†56041†5607356085†56087
Nicollet County · 440 mg/L · Very hard
56003†56021†56054†56074†56082†
Traverse County · 435 mg/L · Very hard
56236†56296†56583†
Big Stone County · 430 mg/L · Very hard
56210†56211†56225†56227†56240†56276†56278†
Swift County · 425 mg/L · Very hard
56208†56215†56231†56249†56252†56271†
Jackson County · 420 mg/L · Very hard
56111†56137†5614356150†56161†56167†
Stevens County · 420 mg/L · Very hard
56207†56221†56235†56244†56267†
Chippewa County · 410 mg/L · Very hard
56222†56260†56262†56265†56295†
McLeod County · 405 mg/L · Very hard
55312†55336†55350†55354†55370†55381†55385†55395†
Carver County · 400 mg/L · Very hard
55315†5531755318†5532255339†55360†55367†55368†5538655387†5538855397†
Murray County · 390 mg/L · Very hard
56114†56122†56123†561255613156141†56151†56172†
Sibley County · 390 mg/L · Very hard
55307†55334†55335†55338†55366†55396†56044†
Le Sueur County · 380 mg/L · Very hard
56017†56028†56050†56052†56057†56058†56069†56071†56096†
Pipestone County · 375 mg/L · Very hard
56128†56139†56140†56164†56170†56186†
Faribault County · 367.5 mg/L · Very hard
56013†56014†56023†56025†56027†56033†5605156097†56098†
Cottonwood County · 363 mg/L · Very hard
56101†56118†56145†5615956174†56183
Scott County · 362.5 mg/L · Very hard
550205505455352†55372†553785537956011†
Blue Earth County · 360 mg/L · Very hard
56001†56010†56024†56034†56037†56055†56063†56065†56068†56078†5608056090†
Martin County · 352 mg/L · Very hard
56031†56039†5607556088†56121†56127†56160†56162†56171†56176†56181†
Clay County · 350 mg/L · Very hard
5651456525†5652956536†56546†56547†56549†56552†56560565625656356580†56585†
Rock County · 350 mg/L · Very hard
5611656134†56138†56144†56146†5614756156†56158†56173†
Steele County · 340 mg/L · Very hard
550495506055917†56026†56046†
Waseca County · 335 mg/L · Very hard
56048†56072†56091†56093†
Rice County · 324.5 mg/L · Very hard
55019†5502155046†55052†55053†5505755087†55088†
Meeker County · 320 mg/L · Very hard
55324†5532555329†55355†55389†56228†56243†
Watonwan County · 320 mg/L · Very hard
5602256056†56060†560625608156120
Pope County · 313 mg/L · Very hard
56226†56316†56323†56327†56334†56349†56381†56385†
Olmsted County · 303.5 mg/L · Very hard
5590155902†5590355904†5590555906†55920†55929†55932†55934†55960†55976
Dodge County · 300 mg/L · Very hard
55924†5592755940†55944†55955†55985†
Norman County · 300 mg/L · Very hard
56510†56519†5654156545†56548†56550†56574†56581†56584†
Fillmore County · 293 mg/L · Very hard
55922†55923†55935†55939†55949†55954†55962†55965†5597155975†55990†
Red Lake County · 288 mg/L · Very hard
56715†56742†56748†56750†
Freeborn County · 280 mg/L · Very hard
5600756009†56016†5602056029†56032†5603556036†5604256043†56045†56089†
Houston County · 280 mg/L · Very hard
55919†55921†55931†55941†55943†55947†55974†
Marshall County · 280 mg/L · Very hard
56710†56713†56724†56737†56738†56744†56757†56758†56760†
Wabasha County · 270 mg/L · Very hard
55041†55945†55956†55957†55964†55968†55981†55991†
Mower County · 268 mg/L · Very hard
55909†5591255918†55926†55933†55936†5595055951†55953†55961†55967†55970†55973†55977†55982†
Kittson County · 260 mg/L · Very hard
56720†56728†5672956731†56732†56733†56734†56735†56755†
Dakota County · 252 mg/L · Very hard
55024†55031†5503355044†55065†55068†550755507655077†5508555118†5512055121551225512355124551505530655337
Kandiyohi County · 250 mg/L · Very hard
5620156209†56216†56251†56253†56273†56279†56281†56282†56288†56289†
Stearns County · 250 mg/L · Very hard
55320†55353†55382†56301†5630356307†56310†56312†56320†5632156325†56331†56335†56340†56352†56356†56362†56368†56369†5637156374†56375†5637656377†56378†56387
Wadena County · 250 mg/L · Very hard
56464†56477†56481†56482†
Goodhue County · 240 mg/L · Very hard
55009†55018†55026†55027†55066†55089†55946†55963†55983†55992†
Polk County · 240 mg/L · Very hard
56517†56523†56535†5654056542†56556†56568†56592†56646†56684†56716†56721†56722†56723†56736†56762†
Wilkin County · 240 mg/L · Very hard
56520†56522†56543†56553†56565†56579†56594†
Wright County · 240 mg/L · Very hard
5530155302†5531355321†55328†553415534955358†55362†55363†5537655390†
Otter Tail County · 233 mg/L · Very hard
56324†56361†56453†56515†56518†56524†56527†56528†56533†56534†565375655156567†56571†56572†56573†56576†56586†56587†56588†
Mahnomen County · 230 mg/L · Very hard
56516†56557†56566†56589†56651†
Roseau County · 230 mg/L · Very hard
56714†56726†56751†56756†56759†56761†56763†
Winona County · 230 mg/L · Very hard
55910†55925†55952†55959†55969†55972†55979†55987†
Pennington County · 228.5 mg/L · Very hard
56701†56725†56754†
Hennepin County · 220 mg/L · Very hard
5511155305553115531655327†5533155340†5534355344†5534555346553475535655357†55359†55364553695537355374†55375†5538455391†55401554025540355404554055540655407554085540955410554115541255413554145541555416554175541855419554205542255423554245542555426554275542855429†5543055431554355543655437554385543955441†55442554435544455445554465544755450†5545455455
Todd County · 220 mg/L · Very hard
56318†56336†5634756360†56389†56434†56437†56438†56440†56446†56479†
Becker County · 212 mg/L · Very hard
5650156511†56521†56544†56554†56569†56570†56575†56578†56591†
Douglas County · 207 mg/L · Very hard
5630856315†56319†56326†56332†56343†56354†56355†
Anoka County · 186 mg/L · Very hard
55005†55011†5501455025†55070†55092†55303†55304†554215543255433554345544855449†
Beltrami County · 183 mg/L · Very hard
56601†56630†56647†56650†56663†56666†56667†56670†56678†56683†56685†56727†
Sherburne County · 171 mg/L · Hard
55308†55309†55319†55330†55398†56304†
Clearwater County · 170 mg/L · Hard
56621†56634†56644†56652†56671†56676†
Chisago County · 160 mg/L · Hard
55012†5501355032†55045†5505655069†55074†55079†55084†
Isanti County · 150 mg/L · Hard
55008†55017†55029†55040†55080†
Morrison County · 149 mg/L · Hard
56314†56328†56338†56345†56364†56373†56382†5638456443†56475†
Benton County · 147.5 mg/L · Hard
56329†56357†56367†56379†
Cass County · 135 mg/L · Hard
56435†56452†56466†56472†56473†5647456484†56626†56633†56641†56655†56662†56672†
Ramsey County · 123 mg/L · Hard
5510155102551035510455105551065510755108551095511055112†55113551145511655117551195512655127†5513055155
Itasca County · 120 mg/L · Hard
55709†55716†55721†5572255742†557445575355764†55769†55775†55781†55784†55786†55793†56628†56636†56637†56639†56657†56659†56680†56681†56688†
Aitkin County · 110 mg/L · Moderately hard
5574855752†55760†55785†55787†56342†56350†56431†56469†
Washington County · 105 mg/L · Moderately hard
55001†55003550165503855042†5504355047†5505555071†55073†550825509055115551255512855129
Hubbard County · 100.5 mg/L · Moderately hard
56433†56458†56461†56467†56470†
Crow Wing County · 100 mg/L · Moderately hard
56401†5642556441†56442†56444†56447†56448†56449†56450†56455†56465†56468†
Mille Lacs County · 100 mg/L · Moderately hard
55371†5631356330†56353†56359†56363†56386†
Kanabec County · 78 mg/L · Moderately hard
55006†55007†55051†56358†
Pine County · 64 mg/L · Moderately hard
55030†55036†55037†55063†55072†55704†55712†55735†55756†55783†55795†
St. Louis County · 62 mg/L · Moderately hard
55602†55702†55703†55705†55706†5570855710†55711†55713†55717†55719†55723†55724†55725†55732†55734†55736†55738†55741†55746†55750†55751†55758†55763†55765†55768†55771†55779†55782†55790†55792†55802†55803†55804†55805558065580755808†55810†558115581255814†
Carlton County · 59.3 mg/L · Soft
55707†55718†55720†55726†55733†55749†55757†5576755780†55797†55798†
Lake of the Woods County · 49 mg/L · Soft
56623†56673†56686†56711†
Koochiching County · 44 mg/L · Soft
5577256627†56629†56649†56653†56654†56658†56660†56661†5666856669†
Lake County · 21 mg/L · Soft
55601†55603†55607†55609†55614†55616†55731†55796†
Cook County · 19 mg/L · Soft
55604†55605†55606†55612†55613†55615†
† 681 ZIP codes are not served by a mapped community water system — most are private-well areas. See well water hardness.
Source
Groundwater vs surface water
Minnesota's groundwater measures harder than its surface water — 286 mg/L across 4,311 samples versus 132 across 56,739, about 2.2× harder. Wells draw from groundwater, so well owners in Minnesota tend to see the harder number — 286 mg/L, very hard. Groundwater readings there run 130 to 540.3 mg/L across the middle 80% of samples. The comparison draws on 3,251 groundwater and 4,515 surface-water monitoring sites; 14 readings above 2,000 mg/L were logged but held out of the medians as outliers.
Groundwater (wells)
286 mg/L as CaCO₃ · 4,311 results at 3,251 stations.
Surface water (rivers, lakes)
132 mg/L as CaCO₃ · 56,739 results at 4,515 stations.
Groundwater measures about 2.2× harder than surface water here.
Chemistry
Water chemistry in Minnesota
Beyond the hardness number, Minnesota's water carries a fuller chemical signature — here is how its measured parameters compare to national benchmarks.
TDS
207 mg/L · n=42,529
207 mg/L — below the national county median of 226.
pH
7.8 pH · n=182,999
pH 7.8 — within the EPA secondary range of 6.5–8.5, on the alkaline side.
Alkalinity
120 mg/L as CaCO3 · n=26,352
120 mg/L — substantial buffering capacity, which resists pH swings.
Calcium : Magnesium
57.6 : 23.2 mg/L ≈ 2.48 : 1 · n=11,101
Calcium is about 60% of Minnesota's hardness (57.6 mg/L Ca to 23.2 mg/L Mg), a little more magnesium-rich than the national ~68% calcium share.
Parameter medians may include a small share of quality-control samples; the hardness lane is fully QC-filtered.
Aquifers
Major aquifers under Minnesota
3 aquifer systems supply much of Minnesota's measured groundwater.
- Cambrian-Ordovician aquifer system — median 317 mg/L across 139 samples at 77 sites: very hard.
- Upper carbonate aquifer — median 292 mg/L across 11 samples at 9 sites: very hard.
- Sand and gravel aquifers (glaciated regions) — median 288 mg/L across 781 samples at 363 sites: very hard.
Together these systems account for 931 measured samples at 449 sites. Aquifer medians pool samples across a whole system and can mask local variation — see the national aquifer map for how these compare across states.
Trend
Hardness over time
Minnesota's decade median moved from 71 mg/L in the 1950s to 210 in the 2020s. Over the series, the decade median peaked at 210 mg/L in the 1960s and bottomed at 71 in the 1950s. Decade medians reflect where and what agencies sampled in each era, not just changes in the water itself.
Scale
Where Minnesota sits on the scale
On the USGS scale, Minnesota's 140 mg/L is hard — 8.2 grains per gallon, above the 120 mg/L hard cutoff, below very hard.
At 140 mg/L (8.2 gpg), water-softener owners in Minnesota typically set their unit to this hardness — settings calculator.
Questions
Frequently asked questions
- Is Minnesota's water hard?
- Minnesota's median hardness is 140 mg/L as CaCO₃, "hard" on the USGS scale and 1× the national county median of 140 mg/L. About 87% of residents in measured counties have hard-or-worse water.
- Which county in Minnesota has the hardest water?
- Lyon County, with a median of 565.5 mg/L as CaCO₃ across 148 measurements.
- Is well water harder than city water in Minnesota?
- Groundwater measures harder here — about 2.2× the surface water — so wells tend to run harder (groundwater 286 vs surface water 132 mg/L).
- How do I find my exact hardness in Minnesota?
- Search your ZIP on the lookup tool, read your utility's Consumer Confidence Report, or test at home with a kit.
- Is Minnesota's water harder than the national average?
- Yes. Minnesota's median of 140 mg/L is 1× the national county median of 140 mg/L, and Minnesota ranks #22 of the 50 states and D.C.
Compare
States with similar hardness
Two states measure closest to Minnesota's 140 mg/L: California at 150 mg/L and Idaho at 130 mg/L. Minnesota measures harder than 58% of states. Browse the full ranking on the statistics page.
More: hardness scale · check your address · national statistics · the national map.
By Marko Visic, MPharm, BSc Physics. Source: USGS/EPA Water Quality Portal — 62,159 Minnesota measurements. Data last verified . Methodology.
Cite this page: “Minnesota Water Hardness by County.” Hard Water Map. Retrieved 2026-07-22, https://hardwatermap.com/water-hardness/minnesota/