California Water Hardness by County
Water in California has a median hardness of 150 mg/L as CaCO₃ — "hard" on the USGS scale — based on 105,884 measurements at 20,318 monitoring stations. San Luis Obispo County has the state's hardest measured water (620 mg/L); Tuolumne County the softest (3.1). Rank: #20 of the 50 states and D.C.
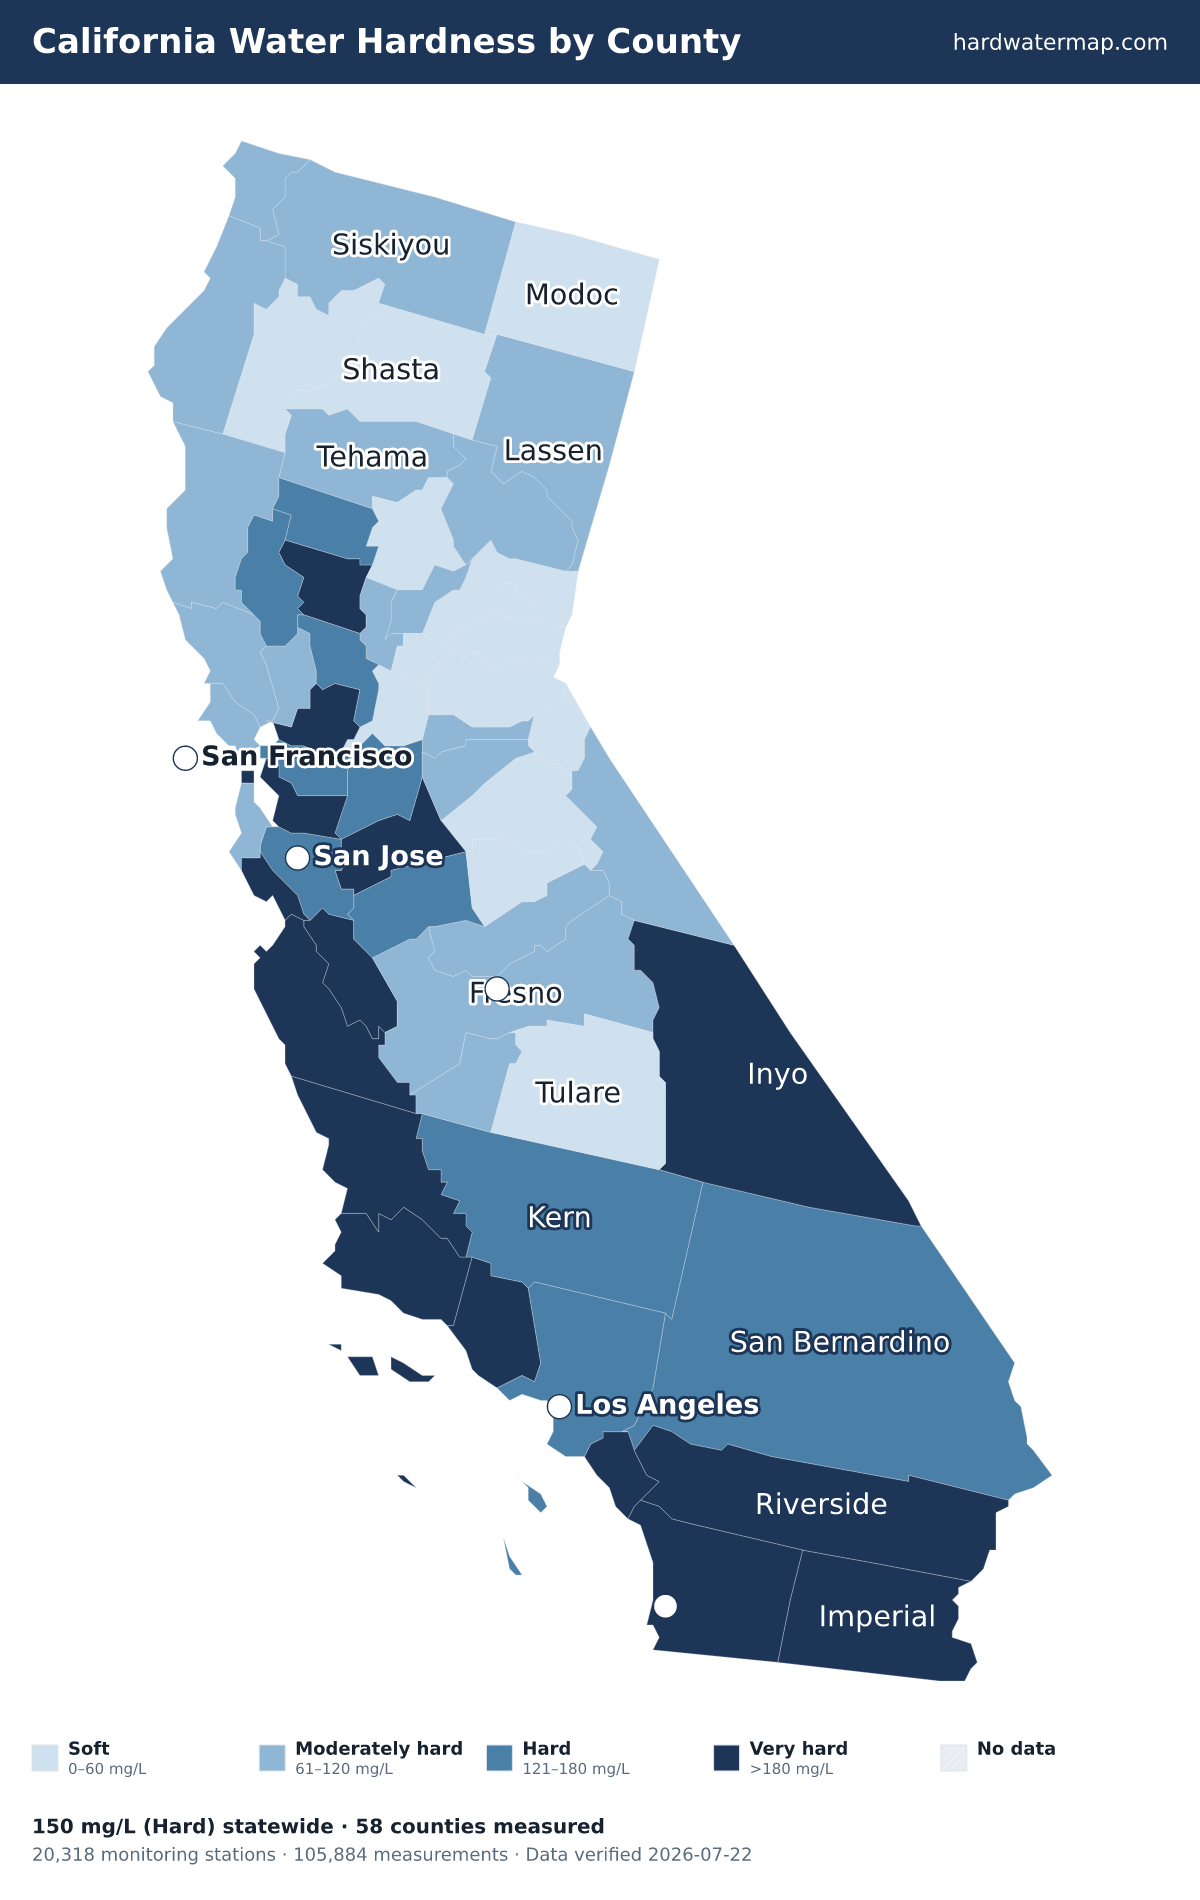
California water hardness map — what the numbers mean. Data verified 2026-07-22.
Of California's 58 measured counties, 16 very hard, 10 hard, 19 moderately hard, and 13 soft. The hardest are San Luis Obispo County (620 mg/L), Santa Barbara County (506), and San Benito County (500). Tuolumne County is the softest at 3.1 mg/L (soft).
About 82% of California's roughly 39.2 million residents in counties with gate-passing hardness data live where tap water is hard or worse.
Statewide, California's median works out to 8.8 grains per gallon and ranks #20 of the 50 states and D.C. Across 105,884 measurements at 20,318 stations — 19,599 of them since 2000 — the middle 80% of readings fall between 32 and 550 mg/L. The public record runs from 1906 to 2025.
See where California sits nationally on the national map, or what its number means on the hardness scale.
Download the California water hardness map (PNG) — Water hardness by county in California: 58 counties mapped from USGS/EPA data, statewide median 150 mg/L (hard); darker counties have harder water.
By county
Water hardness by county
The table lists all 58 measured California counties, hardest first. Their medians span 620 mg/L in San Luis Obispo County to 3.1 in Tuolumne County — a 200× range.
| County | Median | Band | Results | Sites | Newest |
|---|---|---|---|---|---|
| San Luis Obispo County | 620 | Very hard | 1,037 | 179 | 2023 |
| Santa Barbara County | 506 | Very hard | 8,230 | 1,676 | 2023 |
| San Benito County | 500 | Very hard | 239 | 58 | 2022 |
| Ventura County | 470 | Very hard | 1,421 | 332 | 2022 |
| Imperial County | 370 | Very hard | 4,272 | 539 | 2023 |
| San Diego County | 300 | Very hard | 4,083 | 1,046 | 2022 |
| Solano County | 260 | Very hard | 268 | 129 | 2020 |
| San Francisco County | 250.5 | Very hard | 314 | 77 | 2017 |
| Santa Cruz County | 248 | Very hard | 1,186 | 208 | 2023 |
| Alameda County | 240 | Very hard | 6,459 | 311 | 2022 |
| Stanislaus County | 230 | Very hard | 3,252 | 542 | 2021 |
| Monterey County | 220.5 | Very hard | 882 | 293 | 2023 |
| Riverside County | 215 | Very hard | 6,384 | 1,474 | 2023 |
| Orange County | 200 | Very hard | 1,954 | 495 | 2020 |
| Inyo County | 182 | Very hard | 508 | 178 | 2023 |
| Colusa County | 180 | Very hard | 806 | 198 | 2025 |
| Los Angeles County | 179 | Hard | 4,129 | 1,057 | 2023 |
| Santa Clara County | 170 | Hard | 1,792 | 136 | 2023 |
| Yolo County | 170 | Hard | 1,193 | 245 | 2021 |
| Contra Costa County | 160 | Hard | 661 | 99 | 2022 |
| Merced County | 160 | Hard | 2,676 | 609 | 2023 |
| San Bernardino County | 153 | Hard | 11,176 | 2,382 | 2023 |
| Glenn County | 140 | Hard | 879 | 204 | 2021 |
| Lake County | 130 | Hard | 907 | 37 | 2019 |
| San Joaquin County | 130 | Hard | 3,662 | 599 | 2023 |
| Kern County | 120 | Hard | 3,322 | 1,438 | 2023 |
| Sonoma County | 117 | Moderately hard | 1,341 | 194 | 2022 |
| Napa County | 109 | Moderately hard | 774 | 87 | 2023 |
| Kings County | 102 | Moderately hard | 348 | 282 | 2021 |
| Amador County | 96.8 | Moderately hard | 19 | 16 | 2022 |
| Madera County | 90.6 | Moderately hard | 420 | 265 | 2023 |
| Marin County | 86 | Moderately hard | 209 | 51 | 2022 |
| Fresno County | 85 | Moderately hard | 3,919 | 1,541 | 2023 |
| Tehama County | 85 | Moderately hard | 2,038 | 241 | 2022 |
| Calaveras County | 82 | Moderately hard | 248 | 40 | 2021 |
| Mendocino County | 78 | Moderately hard | 1,423 | 167 | 2020 |
| Siskiyou County | 77 | Moderately hard | 1,108 | 127 | 2020 |
| Humboldt County | 74 | Moderately hard | 2,508 | 124 | 2020 |
| Sutter County | 72 | Moderately hard | 1,278 | 169 | 2021 |
| Lassen County | 67 | Moderately hard | 424 | 75 | 2023 |
| Plumas County | 65 | Moderately hard | 179 | 38 | 2020 |
| San Mateo County | 65 | Moderately hard | 624 | 67 | 2022 |
| Yuba County | 62 | Moderately hard | 421 | 110 | 2021 |
| Mono County | 61.9 | Moderately hard | 1,445 | 151 | 2022 |
| Del Norte County | 61 | Moderately hard | 852 | 32 | 2020 |
| Modoc County | 59 | Soft | 442 | 29 | 2020 |
| Sacramento County | 52.3 | Soft | 2,815 | 289 | 2023 |
| Butte County | 49 | Soft | 1,301 | 206 | 2021 |
| Trinity County | 46 | Soft | 230 | 23 | 2015 |
| Shasta County | 44 | Soft | 3,079 | 311 | 2022 |
| Nevada County | 36 | Soft | 1,418 | 77 | 2023 |
| Placer County | 35 | Soft | 1,021 | 152 | 2022 |
| Sierra County | 34 | Soft | 19 | 12 | 2016 |
| Alpine County | 31 | Soft | 206 | 24 | 2008 |
| Tulare County | 30 | Soft | 1,631 | 511 | 2023 |
| El Dorado County | 13.8 | Soft | 907 | 156 | 2022 |
| Mariposa County | 7.4 | Soft | 1,151 | 127 | 2023 |
| Tuolumne County | 3.1 | Soft | 394 | 83 | 2018 |
ZIP codes
ZIP codes in California
The ZIP codes below are grouped by the California county each mostly falls within (by land area). Each ZIP takes that county's measured median — shown in the group header — so this is a ZIP-to-county guide, not a separate reading for every ZIP. To check the water system serving a specific address, use the lookup.
Key: a † after a ZIP means it has no mapped community water system — usually a private-well area. Plain ZIPs are served by a mapped community water system.
San Luis Obispo County · 620 mg/L · Very hard
9340193402†93405†93407†93408†934099341093420†9342293424†93428†93430†93432†9343393442†9344493445†93446†93449†93452†93453†93461†93465
Santa Barbara County · 506 mg/L · Very hard
93013†93067931019310393105†931069310893109931109311193117†93254†93427†93429†93434†93436†9343793440†93441†93454†93455†93458†93460†93463
San Benito County · 500 mg/L · Very hard
95023†95043†95045†95075†
Ventura County · 470 mg/L · Very hard
9132091360913619136291377930019300393004930109301293015930219302293023†9303093033930359303693040†93041930429304393060†9306393064930659306693225†93252†
Imperial County · 370 mg/L · Very hard
92222†92227†92231†92233†92243†92249†92250†92251†92257†92259†92266†92273†92275†92281†92283†
San Diego County · 300 mg/L · Very hard
919019190291905†91906†919109191191913919149191591916†91917†91931†9193291934†91935†91941919429194591948†9195091962†91963†919779197891980†9200392004†9200792008920099201092011920149201992020920219202492025†9202692027†920289202992036†9203792040†920549205592056920579205892059†9206092061920649206592066†920679206992070†9207192075920789208192082920839208492086†9209192092920939209692101†9210292103921049210592106921079210892109921109211192113921149211592116921179211892119†9212092121921229212392124921269212792128921299213092131†921329213492135921369213992140921459214792154921559216192173921799218292672
Solano County · 260 mg/L · Very hard
94510†94512†9453394534†9453594571†94585†94589945909459194592†95620†9562595687†95688
San Francisco County · 250.5 mg/L · Very hard
94102941039410494105941079410894109941109411194112941149411594116941179411894121941229412394124941279412994130941319413294133941349415894188
Santa Cruz County · 248 mg/L · Very hard
95003†9500595006950079501095017†95018†95019950339504195060†950629506495065†95066†95073†95076
Alameda County · 240 mg/L · Very hard
94501945029453694538945399454194542945449454594546945509455194552†945559456094566945689457794578945799458094586945879458894601946029460394605946069460794608946099461094611946129461394618946199462194702947039470494705947069470794709947109472095391
Stanislaus County · 230 mg/L · Very hard
95230†95307†95313†95316†95319†95323†95326†95328953509535195354953559535695357953589536095361†95363†953679536895380†9538295385†95386†95387†
Monterey County · 220.5 mg/L · Very hard
93426†93450†93451†93901939059390693907†93908†93920†9392193923†93924†93925†93926†93927†93928†93930†93932†9393393940†9394393944939509395393954†9395593960†9396295004†95012†95039†
Riverside County · 215 mg/L · Very hard
917529220192203922109221192220†9222392225†92230922349223692239†922409224192253922549225892260922629226492270922749227692282923209250192503925049250592506925079250892509925189252192530†9253292536†92539†9254392544†925459254892549†9255192553925559255792561†92562925639256792570925719258292583925849258592586925879259092591925929259592596928609287992880†928819288292883
Orange County · 200 mg/L · Very hard
906209062190623†906309063190680907209074090742907439260292603926049260692610926129261492617926189262092624926259262692627926299263092637926469264792648926499265192653926559265692657926609266192662926639267392675926769267792678†92679926839268892691926929269492697927019270392704927059270692707927089278092782928019280292804928059280692807928089282192823928319283292833928359284092841928439284492845928619286592866928679286892869928709288692887
Inyo County · 182 mg/L · Very hard
92328†92384†92389†93513†93522†93526†93530†93545†93549†
Colusa County · 180 mg/L · Very hard
95912†95932†95950†95955†95970†95979†95987†
Los Angeles County · 179 mg/L · Hard
900019000290003900049000590006900079000890010900119001290013900149001590016900179001890019900209002190022900239002490025900269002790028900299003190032900339003490035900369003790038900399004090041900429004390044900459004690047900489004990052900569005790058900599006190062900639006490065900669006790068900699007190073900779007990089900949009590201902109021190212902209022190222†902309023290240902419024290245902479024890249902509025490255902609026290263902659026690270902729027490275902779027890280902909029190292†902939030190302903039030490305904019040290403904049040590501905029050390504905059050690601†9060290603906049060590606906389063990640906509066090670907019070390704907069071090712907139071590716907179072390731†9073290744907459074690747907559080290803908049080590806908079080890810908139081490815908229083190840910019100691007910089101091011910169102091024910309104091042†9104691101911039110491105911069110791108911259120191202912039120491205912069120791208912109121491301913029130391304913069130791311†91316913219132491325913269133091331913359134091342†91343913449134591350913519135291354913559135691364913679137191381†91384†91387†91390†914019140291403914059140691411914239143691501915029150491505915069160191602916049160591606916079160891702†91706917119172291723917249173191732917339174091741917449174591746†9174891750917549175591759†917659176691767917689177091773917759177691780†91789917909179191792918019180392397†935109353293534935359353693543†93544†93550†935519355293553†93563†93591
Santa Clara County · 170 mg/L · Hard
94022940249404094041940439408594086940879408994301943039430494305943069500295008950139501495020950309503295035950379504695050950519505395054950709511095111951129511395116951179511895119951209512195122951239512495125951269512795128951299513095131951329513395134951359513695138951399514095148
Yolo County · 170 mg/L · Hard
9560595606†95607†95612†95616†9561895627†95637†95645†95653†95679†95691†95694†95695†9569795698†95776†95937
Contra Costa County · 160 mg/L · Hard
94505†94506945079450994511†9451394514†9451694517†945189451994520945219452394525†945269452894530945319454794548†9454994553†94556†9456194563945649456594569†94572†94575945829458394595945969459794598†947089480194803948049480594806
Merced County · 160 mg/L · Hard
93620†93635†9366595301†95303†95312†9531595317†95322†95324†95333†95334†95340†95341†95348†95365†95369†95374†95388†
San Bernardino County · 153 mg/L · Hard
9170191708917099171091730917379173991761917629176391764917849178692242†9225292256†92267†92268†92277†92278†92280†9228492285†92301†92304†92305†92307†9230892309†92310†92311†923139231492315†9231692317923219232292324923259232792332†92333†92335923369233792338†92339†92341†9234292344923459234692347†92350923529235492356†92358†9235992363†92364†92365†92368†92369923719237292373†923749237692377923789238292385†923869239192392923949239592398†923999240192404†9240592407924089241092411924159355893562†
Glenn County · 140 mg/L · Hard
95913†95920†95939†95943†95951†95963†95988†
Lake County · 130 mg/L · Hard
95422†95423†95426†95435†95443†95451†95453†95457†95458†95461†9546495467†95485†95493†
San Joaquin County · 130 mg/L · Hard
9520295203952049520595206†9520795209952109521195212†95215†95219†95220†95227†95231†95236†9523795240†95242†95253†95258†95304†95320953309533695337953669537695377†95686†
Kern County · 120 mg/L · Hard
93203†93205†93206†93215†93220†93222†9322493226†93240†93241†93243†93249†93250†9325193255†932639326893276†93280†93283†93285†93287†93301933049330593306†93307†93308†9330993311†9331293313†9331493501935059351693518†9351993523935249352893531†93554935559356093561†93581
Sonoma County · 117 mg/L · Moderately hard
94515†94922†94923†94928949319495194954†94972†95401†95403954049540595407†95409†95412†9541995421†95425†9543095431†9543695439†95441†95442†95444†9544695448†95450†95452†9546295465†95471†95472†95476†95480†954869549295497
Napa County · 109 mg/L · Moderately hard
945039450894558†9455994562†94567†9457394574†9457694599†
Kings County · 102 mg/L · Moderately hard
9320293204†93212†93230†93239†932459324693266†
Amador County · 96.8 mg/L · Moderately hard
9560195629†95640956429566595666†95669†9567595685†95689†95699
Madera County · 90.6 mg/L · Moderately hard
93601†93604†93610†93614†93626†93636†93637†93638†93643†93644†93645†93653†93669†
Marin County · 86 mg/L · Moderately hard
9490194903949049492094924†9492594929†949309493394937†94938†9493994940949419494594946†94947949499495094952†94956†949579496094963949649496594970†94971†94973
Fresno County · 85 mg/L · Moderately hard
93210†93234†93242†93602†93605†93606†93608†93609†93611936129361693619†93621†9362293624†93625†93627†93628†93630†93634†93640†93641†93648†9365093651†93652†93654†93656†93657†93660†93662†93664†93667†9366893675†937019370293703†93704†9370593706†9371093711†93720937219372293723†93725†9372693727937289373093737†9374093741
Tehama County · 85 mg/L · Moderately hard
9602196022†96029†96035†96055†96059†96061†96063†96074†96075†96078†96080†96090†96092†
Calaveras County · 82 mg/L · Moderately hard
9522195222†95224†95225†95226†95228†95232†95233†95245†95246†9524795248†95249†95251†952529525495255†95257†
Mendocino County · 78 mg/L · Moderately hard
95410†95415†95417†95420†95427†95428†95429†95432†95437†95445†95449†95454†95456†95459†95460†95463†95466†95468†95469†95470†95482†95488†95490†95494†95585†95587†
Siskiyou County · 77 mg/L · Moderately hard
95568†96014†96023†96025†96027†96031†96032†96034†96037†96038†96039†96044†96050†96057†96058†96064†9606796085†96086†96094†96097†
Humboldt County · 74 mg/L · Moderately hard
955019550395511†95514†95519955219552495525†95526†95528†95536†955379554095542†95545†95546†95547†95549†9555095551†95553†95554†95555†95556†95558†95559†95560†95562†9556495565†95569†95570†95571†95573†95589†
Sutter County · 72 mg/L · Moderately hard
95659†95668†95674†95676†95953†95957†95982†95991†95993†
Lassen County · 67 mg/L · Moderately hard
96006†96009†96056†96068†96109†96113†96114†96117†96119†96121†96123†96128†96130†96132†96136†96137†
Plumas County · 65 mg/L · Moderately hard
95915†95923†95934†95947†95956†95971†95981†95983†95984†96020†96103†96105†96106†9612296129†96135†
San Mateo County · 65 mg/L · Moderately hard
94002940059401094014†940159401894019†94020†94021†940259402794028940309403794038†9404494060†940619406294063940659406694070940749408094128†94401944029440394404
Yuba County · 62 mg/L · Moderately hard
9569295901†95903959189591995922†9592595935959619596295972†95977†
Mono County · 61.9 mg/L · Moderately hard
93512†93514†93517†93529†93541†93546†96107†96133†
Del Norte County · 61 mg/L · Moderately hard
95531†95538†95543†95548†95567†
Modoc County · 59 mg/L · Soft
96015†96054†96101†96104†96108†96110†96112†96115†96116†9613497635†
Sacramento County · 52.3 mg/L · Soft
956089561095615†956219562495626†956289563095632†95638†95639†95641†9565295655956609566295670956719567395680†9568395690†95693†9574295757†957589581195814958159581695817958189581995820958219582295823958249582595826958279582895829958309583195832†95833958349583595837†9583895841958429584395864
Butte County · 49 mg/L · Soft
95914†95916†95917†9592695928†9592995930†95938†95941†95942†95948†95954†95958†9596595966†9596895969†95973†95974†95978
Trinity County · 46 mg/L · Soft
95527†95552†95563†95595†96010†96024†96041†96046†96048†96052†96076†96091†96093†
Shasta County · 44 mg/L · Soft
9600196002960039600796008†96011†96013†96016†96017†9601996028†96033†96040†96047†96051†96062†96065†96069†96071†9607396084†96087†96088†96096†
Nevada County · 36 mg/L · Soft
95945†95946†95949†95959†95975†9598696111†96161
Placer County · 35 mg/L · Soft
95602†956039560495631†95648†9565095658†9566195663956779567895681†95701†95703†95713†95714†95715†95717†9572295728†95736†9574695747†9576596140†96141†96143†96145†96146†96148
Sierra County · 34 mg/L · Soft
95910†95936†95944†95960†96118†96124†96125†96126†
Alpine County · 31 mg/L · Soft
95223†95646†96120†
Tulare County · 30 mg/L · Soft
93201†93207†93208†93218†93219†93221†9322393227†9323593237†93238†93244†9324793256†93257†93258†93260†9326193262†93265†9326793270†93271†93272†9327493277†93286†93291†9329293527†93603†93615†93618†93631†9363393646†93647†936669367093673†
El Dorado County · 13.8 mg/L · Soft
95613956149561995623†95633956349563595636†95651†956649566795672†9568295684†9570995720†95721†95726†95735†9576296142†96150†96155†
Mariposa County · 7.4 mg/L · Soft
93623†95306†95311†95318†95325†95338†95345†95389†
Tuolumne County · 3.1 mg/L · Soft
95305†95309†95310†95321†95327†95329†95335†9534695364†95370†95372†95375†95379†95383†
† 738 ZIP codes are not served by a mapped community water system — most are private-well areas. See well water hardness.
Source
Groundwater vs surface water
California's groundwater measures harder than its surface water — 220 mg/L across 53,503 samples versus 92 across 51,905, about 2.4× harder. Wells draw from groundwater, so well owners in California tend to see the harder number — 220 mg/L, very hard. Groundwater readings there run 54 to 718 mg/L across the middle 80% of samples. The comparison draws on 17,636 groundwater and 2,640 surface-water monitoring sites; 1,712 readings above 2,000 mg/L were logged but held out of the medians as outliers.
Groundwater (wells)
220 mg/L as CaCO₃ · 53,503 results at 17,636 stations.
Surface water (rivers, lakes)
92 mg/L as CaCO₃ · 51,905 results at 2,640 stations.
Groundwater measures about 2.4× harder than surface water here.
Chemistry
Water chemistry in California
Beyond the hardness number, California's water carries a fuller chemical signature — here is how its measured parameters compare to national benchmarks.
TDS
428 mg/L · n=19,438
428 mg/L — about 1.9× the national county median of 226, consistent with hard, mineral-rich water.
pH
7.8 pH · n=14,067
pH 7.8 — within the EPA secondary range of 6.5–8.5, on the alkaline side.
Alkalinity
134 mg/L as CaCO3 · n=31,858
134 mg/L — substantial buffering capacity, which resists pH swings.
Calcium : Magnesium
32.6 : 11 mg/L ≈ 2.96 : 1 · n=21,599
Calcium is about 64% of California's hardness (32.6 mg/L Ca to 11 mg/L Mg), a little more magnesium-rich than the national ~68% calcium share.
Parameter medians may include a small share of quality-control samples; the hardness lane is fully QC-filtered.
Aquifers
Major aquifers under California
3 aquifer systems supply much of California's measured groundwater.
- California Coastal Basin aquifers — median 310 mg/L across 19,423 samples at 5,003 sites: very hard.
- Central Valley aquifer system — median 190 mg/L across 11,387 samples at 6,043 sites: very hard.
- Basin and Range basin-fill aquifers — median 130 mg/L across 15,431 samples at 3,464 sites: hard.
Together these systems account for 46,241 measured samples at 14,510 sites. Aquifer medians pool samples across a whole system and can mask local variation — see the national aquifer map for how these compare across states.
Trend
Hardness over time
California's decade median moved from 140 mg/L in the 1910s to 145 in the 2020s. Over the series, the decade median peaked at 440 mg/L in the 1920s and bottomed at 120 in the 1960s. Decade medians reflect where and what agencies sampled in each era, not just changes in the water itself.
Scale
Where California sits on the scale
On the USGS scale, California's 150 mg/L is hard — 8.8 grains per gallon, above the 120 mg/L hard cutoff, below very hard.
At 150 mg/L (8.8 gpg), water-softener owners in California typically set their unit to this hardness — settings calculator.
Questions
Frequently asked questions
- Is California's water hard?
- California's median hardness is 150 mg/L as CaCO₃, "hard" on the USGS scale and 1.07× the national county median of 140 mg/L. About 82% of residents in measured counties have hard-or-worse water.
- Which county in California has the hardest water?
- San Luis Obispo County, with a median of 620 mg/L as CaCO₃ across 1,037 measurements.
- Is well water harder than city water in California?
- Groundwater measures harder here — about 2.4× the surface water — so wells tend to run harder (groundwater 220 vs surface water 92 mg/L).
- How do I find my exact hardness in California?
- Search your ZIP on the lookup tool, read your utility's Consumer Confidence Report, or test at home with a kit.
- Is California's water harder than the national average?
- Yes. California's median of 150 mg/L is 1.07× the national county median of 140 mg/L, and California ranks #20 of the 50 states and D.C.
Compare
States with similar hardness
Two states measure closest to California's 150 mg/L: Nevada at 150 mg/L and Florida at 151 mg/L. California measures harder than 62% of states. Browse the full ranking on the statistics page.
More: hardness scale · check your address · national statistics · the national map.
By Marko Visic, MPharm, BSc Physics. Source: USGS/EPA Water Quality Portal — 105,884 California measurements. Data last verified . Methodology.
Cite this page: “California Water Hardness by County.” Hard Water Map. Retrieved 2026-07-22, https://hardwatermap.com/water-hardness/california/