West Virginia Water Hardness by County
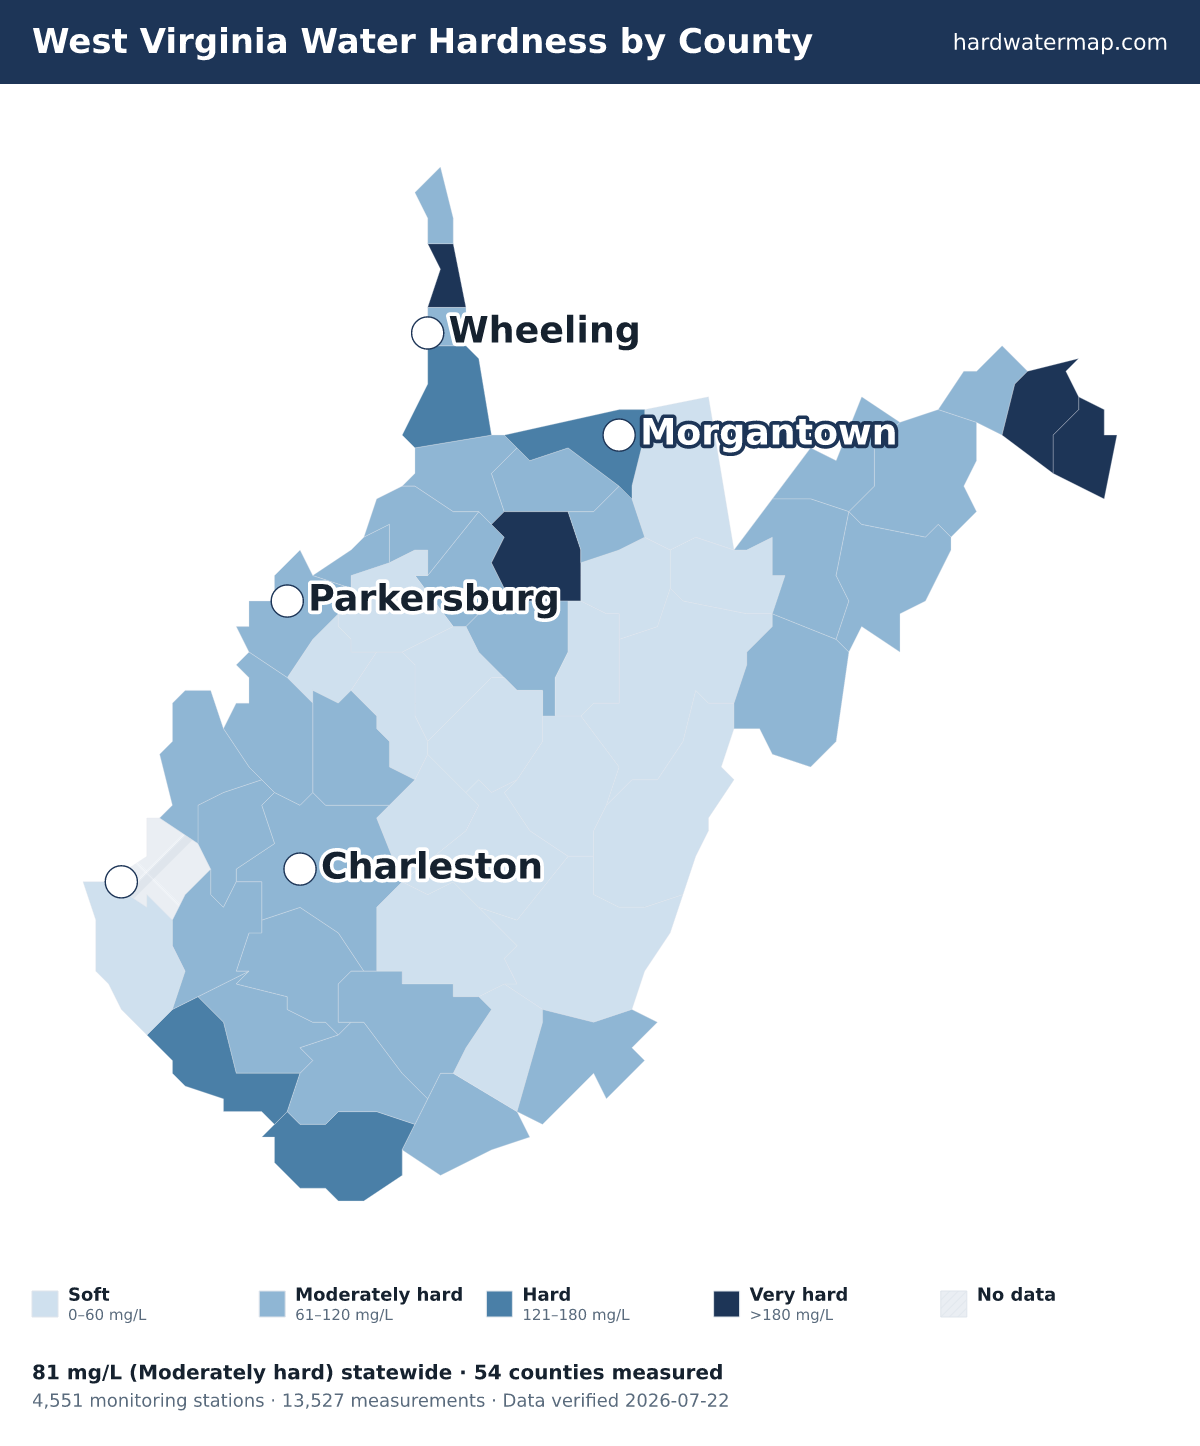
Water in West Virginia has a median hardness of 81 mg/L as CaCO₃ — "moderately hard" on the USGS scale — based on 13,527 measurements at 4,551 monitoring stations. Brooke County has the state's hardest measured water (323 mg/L); Webster County the softest (16.4). Rank: #30 of the 50 states and D.C.
West Virginia water hardness map — what the numbers mean. Data verified 2026-07-22.
Of West Virginia's 54 measured counties, 4 very hard, 4 hard, 28 moderately hard, and 18 soft. The hardest are Brooke County (323 mg/L), Berkeley County (299), and Jefferson County (250). Webster County is the softest at 16.4 mg/L (soft).
About 27% of West Virginia's roughly 1.7 million residents in counties with gate-passing hardness data live where tap water is hard or worse.
Statewide, West Virginia's median works out to 4.7 grains per gallon and ranks #30 of the 50 states and D.C. Across 13,527 measurements at 4,551 stations — 1,707 of them since 2000 — the middle 80% of readings fall between 18 and 231 mg/L. The public record runs from 1916 to 2025.
See where West Virginia sits nationally on the national map, or what its number means on the hardness scale.
Download the West Virginia water hardness map (PNG) — Water hardness by county in West Virginia: 54 counties mapped from USGS/EPA data, statewide median 81 mg/L (moderately hard); darker counties have harder water.
By county
Water hardness by county
The table lists all 54 measured West Virginia counties, hardest first. Their medians span 323 mg/L in Brooke County to 16.4 in Webster County — a 19.7× range. 1 more West Virginia county lacks gate-passing data.
| County | Median | Band | Results | Sites | Newest |
|---|---|---|---|---|---|
| Brooke County | 323 | Very hard | 35 | 16 | 2011 |
| Berkeley County | 299 | Very hard | 193 | 136 | 2022 |
| Jefferson County | 250 | Very hard | 565 | 287 | 2022 |
| Harrison County | 240 | Very hard | 131 | 33 | 2014 |
| Monongalia County | 149 | Hard | 199 | 86 | 2012 |
| Marshall County | 147 | Hard | 292 | 104 | 2019 |
| McDowell County | 130 | Hard | 403 | 124 | 2016 |
| Mingo County | 120 | Hard | 352 | 126 | 2017 |
| Wood County | 118 | Moderately hard | 203 | 21 | 2024 |
| Ohio County | 117 | Moderately hard | 209 | 14 | 2024 |
| Morgan County | 112 | Moderately hard | 157 | 113 | 2020 |
| Hampshire County | 110 | Moderately hard | 127 | 73 | 2020 |
| Jackson County | 110 | Moderately hard | 186 | 31 | 2021 |
| Logan County | 110 | Moderately hard | 314 | 145 | 2020 |
| Mason County | 110 | Moderately hard | 320 | 48 | 2024 |
| Mineral County | 110 | Moderately hard | 205 | 28 | 2022 |
| Hancock County | 104 | Moderately hard | 421 | 13 | 2025 |
| Pleasants County | 98 | Moderately hard | 165 | 13 | 2024 |
| Wetzel County | 98 | Moderately hard | 172 | 26 | 2024 |
| Grant County | 94.6 | Moderately hard | 154 | 36 | 2023 |
| Boone County | 92 | Moderately hard | 510 | 289 | 2017 |
| Mercer County | 87.9 | Moderately hard | 76 | 27 | 2016 |
| Taylor County | 86 | Moderately hard | 32 | 13 | 2014 |
| Raleigh County | 83.8 | Moderately hard | 434 | 163 | 2016 |
| Pendleton County | 83.3 | Moderately hard | 64 | 29 | 1995 |
| Kanawha County | 81 | Moderately hard | 531 | 209 | 2017 |
| Roane County | 77 | Moderately hard | 71 | 55 | 2018 |
| Lincoln County | 76.6 | Moderately hard | 454 | 180 | 2011 |
| Hardy County | 73.9 | Moderately hard | 117 | 39 | 2020 |
| Marion County | 73 | Moderately hard | 232 | 82 | 2021 |
| Putnam County | 70 | Moderately hard | 688 | 87 | 2000 |
| Monroe County | 69.5 | Moderately hard | 84 | 37 | 2010 |
| Wyoming County | 64 | Moderately hard | 640 | 290 | 2016 |
| Lewis County | 63 | Moderately hard | 131 | 32 | 2012 |
| Doddridge County | 61.5 | Moderately hard | 48 | 18 | 2018 |
| Tyler County | 61 | Moderately hard | 92 | 31 | 2018 |
| Ritchie County | 57 | Soft | 116 | 24 | 2018 |
| Summers County | 56 | Soft | 154 | 35 | 2011 |
| Wayne County | 55 | Soft | 378 | 118 | 2020 |
| Fayette County | 53.2 | Soft | 255 | 113 | 2021 |
| Preston County | 52 | Soft | 223 | 59 | 2021 |
| Clay County | 48 | Soft | 108 | 74 | 1997 |
| Gilmer County | 48 | Soft | 102 | 22 | 2018 |
| Wirt County | 45.7 | Soft | 188 | 8 | 2018 |
| Greenbrier County | 45 | Soft | 360 | 127 | 2020 |
| Calhoun County | 43 | Soft | 60 | 17 | 2018 |
| Braxton County | 35 | Soft | 258 | 132 | 1997 |
| Tucker County | 35 | Soft | 374 | 108 | 2021 |
| Barbour County | 30 | Soft | 103 | 24 | 2012 |
| Upshur County | 30 | Soft | 89 | 33 | 2012 |
| Randolph County | 28 | Soft | 237 | 105 | 2021 |
| Pocahontas County | 24 | Soft | 205 | 80 | 2020 |
| Nicholas County | 23 | Soft | 740 | 208 | 2011 |
| Webster County | 16.4 | Soft | 307 | 90 | 2011 |
ZIP codes
ZIP codes in West Virginia
The ZIP codes below are grouped by the West Virginia county each mostly falls within (by land area). Each ZIP takes that county's measured median — shown in the group header — so this is a ZIP-to-county guide, not a separate reading for every ZIP. To check the water system serving a specific address, use the lookup.
Key: a † after a ZIP means it has no mapped community water system — usually a private-well area. Plain ZIPs are served by a mapped community water system.
Brooke County · 323 mg/L · Very hard
26030†26032†2603526037260582607026075†
Berkeley County · 299 mg/L · Very hard
2540125403†25404†25405†25413†2541925420†25421†25427†25428
Jefferson County · 250 mg/L · Very hard
25414†25425†25430†25432†2543825442†2544325446†
Harrison County · 240 mg/L · Very hard
26301†2632326330†26361†26366†263692638526386†2640426408†26422†264312643826448†264512646326568
Monongalia County · 149 mg/L · Hard
265012650526506†26508†26521†2653426541†26543†26544†26546†2657026590†
Marshall County · 147 mg/L · Hard
260312603326036†26038†26039†26040†2604126055†
McDowell County · 130 mg/L · Hard
24808†24811†24813†24815†24816†24817†24826†24828†24830†24831†24836†24843†24844†24846†24848†24850†24853†24855†24861†24862†24866†24868†24871†24872†24873†24878†24879†24881†24884†24887†24888†2489224894†24895†
Mingo County · 120 mg/L · Hard
24851†25608†25621†25651†2566125666†25667†25670†25671†25672†25674†25676†25678†25685†25688†25690†25692†25696†
Wood County · 118 mg/L · Moderately hard
2610126104†2610526133†2614226150†26169†26180†26181†26184†26187†
Ohio County · 117 mg/L · Moderately hard
26003†2605926060†26074
Morgan County · 112 mg/L · Moderately hard
25411†25422†
Hampshire County · 110 mg/L · Moderately hard
25431†25434†25437†25444†26704†26711†26714†26722†26755†26757†26761†26763†26808†26817†26823†26852†26865†
Jackson County · 110 mg/L · Moderately hard
2523125239†25241†25244†25245†25248†25252†25262†2527125275†26164†
Logan County · 110 mg/L · Moderately hard
25022†25076†25121†25183†2550825547†25601†25606†25607†25611†2561225617†2562425625†25628†25630†25632†25634†25635†2563725638†25639†25644†25646†25647†25649†25650†25652†25653†25654†
Mason County · 110 mg/L · Moderately hard
25106†25123†25187†2524725253†25260†2526425265†25287†25502†25503†25515†25550†
Mineral County · 110 mg/L · Moderately hard
26710†26717†26719†26726†26743†267502675326767†
Hancock County · 104 mg/L · Moderately hard
26034†26047†26050†26056†26062
Pleasants County · 98 mg/L · Moderately hard
26134†26170†
Wetzel County · 98 mg/L · Moderately hard
26155†2615926162†26167†26348†26377†26419†26437†26562†26575†26581†
Grant County · 94.6 mg/L · Moderately hard
26707†26720†26731†26739†26833†26847†26855†
Boone County · 92 mg/L · Moderately hard
25009†2502125024†25028†25047†25049†25051†250532508125093†251082511425130†2514225148†25149†25154†25165†2516925181†25193†25203†25204†25205†25206†25208†25209†25529†
Mercer County · 87.9 mg/L · Moderately hard
24701†2471224714†2471524724†24729†247312473324737†24738†24739†24740†24747†25820†25841†25922†25971†
Taylor County · 86 mg/L · Moderately hard
2634726354†26424†2643526440
Raleigh County · 83.8 mg/L · Moderately hard
25007†25008†25044†25048†25060†25062†25140†25174†25180†25801†25811†25813†25817†25818†25823†258252582725832†25836†25839†25843†25844†258492585125853†25857†25865†258712587325878†2588025902†25908†2590925911†25915†25918†25920†25921†25932†25989†
Pendleton County · 83.3 mg/L · Moderately hard
26802†26804†26807†26814†26815†26866†26884†26886†
Kanawha County · 81 mg/L · Moderately hard
25003†25015†25025†25035†25039†25045†2505425061†25064250672507125075†25083†25086†25102†25103†25107†25110†2511225126†25132†25134†251432515625160†251622517725201†25202†25214†253012530225303253042530525306†25309253112531225313†25314†25315†25320†25387†
Roane County · 77 mg/L · Moderately hard
25005†25243†25251†25259†25266†25270†25276†25286†
Lincoln County · 76.6 mg/L · Moderately hard
25501†25505†2550625521†25523†25524†25540†25544†25557†25564†25565†25567†25571†25573†
Hardy County · 73.9 mg/L · Moderately hard
26801†26810†26812†26818†26836†26838†26845†26851†
Marion County · 73 mg/L · Moderately hard
2655426559†265602656326571†2657226574†26576†26582†26585†26586†2658726588†26591†
Putnam County · 70 mg/L · Moderately hard
2501125033†25070†25082†2510925124†25159†25168†25213†25526†25560
Monroe County · 69.5 mg/L · Moderately hard
24918†24941†2494524951†24963†24974†24976†24983†24984†24985†24993†
Wyoming County · 64 mg/L · Moderately hard
2471624719†24726†24736†24801†24818†24822†24823†24827†24834†24839†24845†2484724849†24854†24857†24860†24867†24869†24870†2487424880†24882†24898†25810†25826†25845†25848†25870†25875†25876†25882†25913†25916†25928†25943†
Lewis County · 63 mg/L · Moderately hard
26321†26338†26343†263722637826412†26447†26452
Doddridge County · 61.5 mg/L · Moderately hard
26339†26411†2642626436†26456†
Tyler County · 61 mg/L · Moderately hard
26146†26149†2617526320†
Ritchie County · 57 mg/L · Soft
26148†26161†26178†26325†26327†26337†26346†26362†26415†26421†
Summers County · 56 mg/L · Soft
24935†24962†24981†25951†25966†25969†25977†2597825979†25985†
Wayne County · 55 mg/L · Soft
25507†25511†25512†25514†25517†2553025534†25535†2555525570†25669†25699†25704†
Fayette County · 53.2 mg/L · Soft
25002†25031†25036†25040†25057†2505925085†2509025115†25118†25119†25136†25139†25152†25161†25173†25185†25186†25812†25831†258372584025846†25854†2585525862†25864†25866†2586825879†25901†25904†25907†2591725936†2593825942†25962†25976†25986†26680†26690†
Preston County · 52 mg/L · Soft
26374†26410†26425†26444†26519†265202652426525†26537†26542†26547†26705†26716†26764†
Clay County · 48 mg/L · Soft
25019†2503025043†25088†25111†25113†25125†25133†25141†2516425211†25285†
Gilmer County · 48 mg/L · Soft
25267†26137†26342†26351†26384†26430†26443†26611†26638†
Wirt County · 45.7 mg/L · Soft
26143†26160†
Greenbrier County · 45 mg/L · Soft
24901†24910†24916†24925†24931†24938†24943†24957†24966†24970†24977†24986†24991†25958†25972†25981†25984†26261†
Calhoun County · 43 mg/L · Soft
25234†25235†25261†25268†26136†26138†26141†26147†26151†26152†
Braxton County · 35 mg/L · Soft
25063†26335†26376†26601†26615†26619†26621†26623†26624†26627†26629†26631†26636†
Tucker County · 35 mg/L · Soft
26260†26269†26271†26287†26289†26292†
Barbour County · 30 mg/L · Soft
26238†2625026275†26349†26405†26416†
Upshur County · 30 mg/L · Soft
26201†2621026218†26228†26234†26237†
Randolph County · 28 mg/L · Soft
26224†26230†26236†26241†26253†26254†26257†26259†26263†26267†26268†26270†26273†26276†26278†26280†26282†2628326285†26293†26294†26296†
Pocahontas County · 24 mg/L · Soft
24915†24920†24924†24927†24934†24944†24946†24954†26209†26264†26291†
Nicholas County · 23 mg/L · Soft
26202†26205†26610†2661726651†26656†26660†26662†26667†26671†26676†2667826679†26681†2668426691†
Webster County · 16.4 mg/L · Soft
26203†26206†26208†26215†26217†26222†26266†26288†26298†
† 604 ZIP codes are not served by a mapped community water system — most are private-well areas. See well water hardness.
Source
Groundwater vs surface water
West Virginia's groundwater measures harder than its surface water — 93.6 mg/L across 3,297 samples versus 77 across 10,182, about 1.2× harder. Wells draw from groundwater, so well owners in West Virginia tend to see the harder number — 93.6 mg/L, moderately hard. Groundwater readings there run 23.5 to 324 mg/L across the middle 80% of samples. The comparison draws on 2,985 groundwater and 1,555 surface-water monitoring sites; 8 readings above 2,000 mg/L were logged but held out of the medians as outliers.
Groundwater (wells)
93.6 mg/L as CaCO₃ · 3,297 results at 2,985 stations.
Surface water (rivers, lakes)
77 mg/L as CaCO₃ · 10,182 results at 1,555 stations.
Groundwater measures about 1.2× harder than surface water here.
Chemistry
Water chemistry in West Virginia
Beyond the hardness number, West Virginia's water carries a fuller chemical signature — here is how its measured parameters compare to national benchmarks.
TDS
210 mg/L · n=1,315
210 mg/L — below the national county median of 226.
pH
7.8 pH · n=2,246
pH 7.8 — within the EPA secondary range of 6.5–8.5, on the alkaline side.
Alkalinity
66 mg/L as CaCO3 · n=967
66 mg/L — modest buffering capacity.
Calcium : Magnesium
30 : 8.3 mg/L ≈ 3.61 : 1 · n=2,390
Calcium is about 69% of West Virginia's hardness (30 mg/L Ca to 8.3 mg/L Mg), a little more calcium-rich than the national ~68% calcium share.
Parameter medians may include a small share of quality-control samples; the hardness lane is fully QC-filtered.
Aquifers
Major aquifers under West Virginia
3 aquifer systems supply much of West Virginia's measured groundwater.
- Valley and Ridge aquifers — median 196.5 mg/L across 697 samples at 510 sites: very hard.
- Alluvial aquifers — median 116 mg/L across 121 samples at 120 sites: moderately hard.
- Mississippian aquifers — median 86 mg/L across 227 samples at 188 sites: moderately hard.
Together these systems account for 1,045 measured samples at 818 sites. Aquifer medians pool samples across a whole system and can mask local variation — see the national aquifer map for how these compare across states.
Trend
Hardness over time
West Virginia's decade median moved from 140 mg/L in the 1940s to 107 in the 2020s. Over the series, the decade median peaked at 140 mg/L in the 1940s and bottomed at 65 in the 1980s. Decade medians reflect where and what agencies sampled in each era, not just changes in the water itself.
Scale
Where West Virginia sits on the scale
On the USGS scale, West Virginia's 81 mg/L is moderately hard — 4.7 grains per gallon, between the 60 and 120 mg/L soft and hard cutoffs.
Questions
Frequently asked questions
- Is West Virginia's water hard?
- West Virginia's median hardness is 81 mg/L as CaCO₃, "moderately hard" on the USGS scale and below the national county median of 140 mg/L.
- Which county in West Virginia has the hardest water?
- Brooke County, with a median of 323 mg/L as CaCO₃ across 35 measurements.
- Is well water harder than city water in West Virginia?
- Groundwater measures harder here — about 1.2× the surface water — so wells tend to run harder (groundwater 93.6 vs surface water 77 mg/L).
- How do I find my exact hardness in West Virginia?
- Search your ZIP on the lookup tool, read your utility's Consumer Confidence Report, or test at home with a kit.
- Is West Virginia's water harder than the national average?
- No. West Virginia's median of 81 mg/L is below the national county median of 140 mg/L; it ranks #30 of the 50 states and D.C.
Compare
States with similar hardness
Two states measure closest to West Virginia's 81 mg/L: Tennessee at 82.9 mg/L and Pennsylvania at 83 mg/L. West Virginia measures harder than 42% of states. Browse the full ranking on the statistics page.
More: hardness scale · check your address · national statistics · the national map.
By Marko Visic, MPharm, BSc Physics. Source: USGS/EPA Water Quality Portal — 13,527 West Virginia measurements. Data last verified . Methodology.
Cite this page: “West Virginia Water Hardness by County.” Hard Water Map. Retrieved 2026-07-22, https://hardwatermap.com/water-hardness/west-virginia/