Wisconsin Water Hardness by County
Water in Wisconsin has a median hardness of 110 mg/L as CaCO₃ — "moderately hard" on the USGS scale — based on 33,134 measurements at 6,437 monitoring stations. Iowa County has the state's hardest measured water (390 mg/L); Lincoln County the softest (13.6). Rank: #26 of the 50 states and D.C.
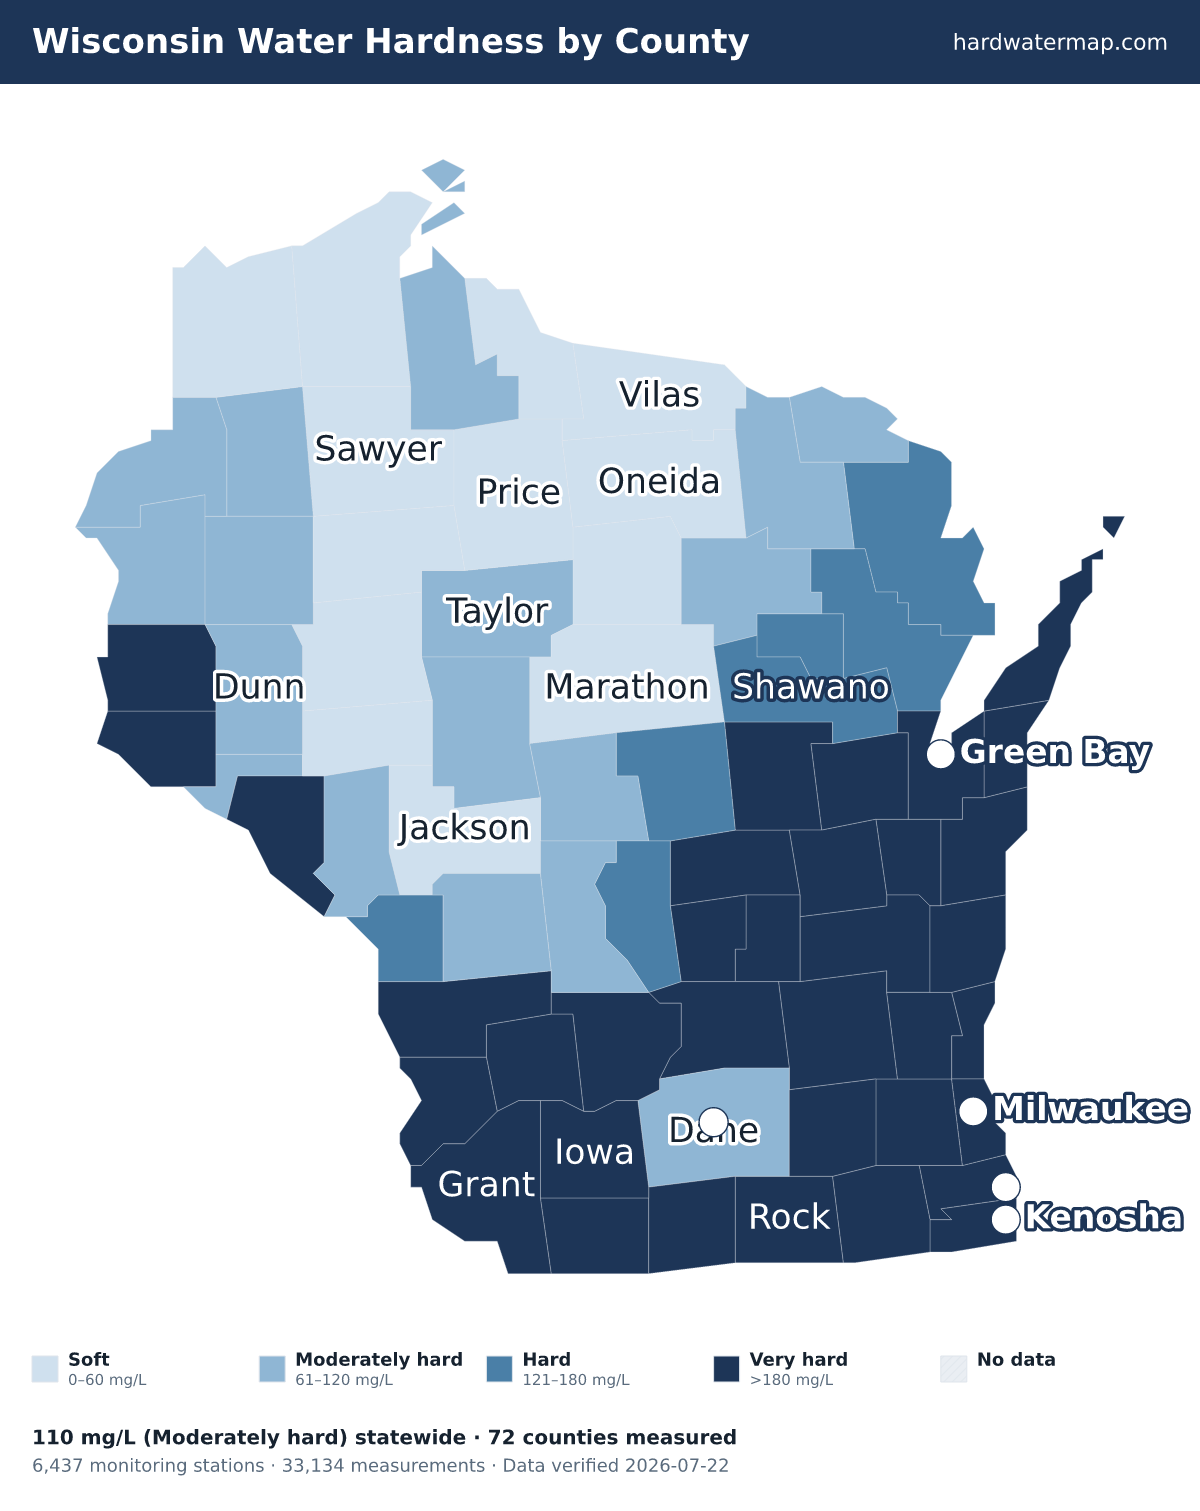
Wisconsin water hardness map — what the numbers mean. Data verified 2026-07-22.
Of Wisconsin's 72 measured counties, 35 very hard, 7 hard, 17 moderately hard, and 13 soft. The hardest are Iowa County (390 mg/L), Calumet County (380), and Lafayette County (350). Lincoln County is the softest at 13.6 mg/L (soft).
About 74% of Wisconsin's roughly 5.9 million residents in counties with gate-passing hardness data live where tap water is hard or worse.
Statewide, Wisconsin's median works out to 6.4 grains per gallon and ranks #26 of the 50 states and D.C. Across 33,134 measurements at 6,437 stations — 11,905 of them since 2000 — the middle 80% of readings fall between 27 and 340 mg/L. The public record runs from 1901 to 2026.
See where Wisconsin sits nationally on the national map, or what its number means on the hardness scale.
Download the Wisconsin water hardness map (PNG) — Water hardness by county in Wisconsin: 72 counties mapped from USGS/EPA data, statewide median 110 mg/L (moderately hard); darker counties have harder water.
By county
Water hardness by county
The table lists all 72 measured Wisconsin counties, hardest first. Their medians span 390 mg/L in Iowa County to 13.6 in Lincoln County — a 28.7× range.
| County | Median | Band | Results | Sites | Newest |
|---|---|---|---|---|---|
| Iowa County | 390 | Very hard | 219 | 52 | 2000 |
| Calumet County | 380 | Very hard | 71 | 43 | 2007 |
| Lafayette County | 350 | Very hard | 139 | 71 | 2004 |
| Kewaunee County | 340 | Very hard | 115 | 37 | 2018 |
| Ozaukee County | 340 | Very hard | 145 | 83 | 2013 |
| Dodge County | 330 | Very hard | 205 | 132 | 2014 |
| Fond du Lac County | 330 | Very hard | 210 | 120 | 2026 |
| Washington County | 320 | Very hard | 421 | 166 | 2023 |
| Rock County | 316.5 | Very hard | 214 | 70 | 2018 |
| Sheboygan County | 315 | Very hard | 575 | 118 | 2013 |
| Green County | 310 | Very hard | 143 | 31 | 2004 |
| Jefferson County | 310 | Very hard | 189 | 108 | 2014 |
| Manitowoc County | 310 | Very hard | 407 | 96 | 2025 |
| Door County | 300 | Very hard | 95 | 57 | 2008 |
| Grant County | 300 | Very hard | 510 | 90 | 2014 |
| Columbia County | 280 | Very hard | 217 | 127 | 2015 |
| Waukesha County | 275 | Very hard | 872 | 225 | 2026 |
| Racine County | 274.5 | Very hard | 392 | 74 | 2023 |
| Crawford County | 270 | Very hard | 139 | 47 | 2010 |
| Richland County | 260 | Very hard | 55 | 24 | 2004 |
| Walworth County | 257 | Very hard | 751 | 167 | 2026 |
| Vernon County | 250 | Very hard | 295 | 67 | 2024 |
| Kenosha County | 241 | Very hard | 223 | 55 | 2024 |
| Outagamie County | 231 | Very hard | 297 | 63 | 2015 |
| Pierce County | 230 | Very hard | 217 | 62 | 2023 |
| Green Lake County | 222 | Very hard | 127 | 28 | 2023 |
| Milwaukee County | 220 | Very hard | 1,945 | 194 | 2023 |
| Waupaca County | 218.5 | Very hard | 242 | 64 | 2026 |
| Brown County | 198 | Very hard | 1,358 | 197 | 2020 |
| Marquette County | 190 | Very hard | 73 | 33 | 2026 |
| Winnebago County | 190 | Very hard | 254 | 71 | 2015 |
| Buffalo County | 180 | Very hard | 176 | 35 | 2024 |
| St. Croix County | 180 | Very hard | 464 | 151 | 2023 |
| Sauk County | 180 | Very hard | 182 | 54 | 2019 |
| Waushara County | 180 | Very hard | 203 | 88 | 2026 |
| Adams County | 160 | Hard | 68 | 30 | 2023 |
| Oconto County | 160 | Hard | 248 | 42 | 2026 |
| La Crosse County | 150 | Hard | 280 | 51 | 2014 |
| Shawano County | 144 | Hard | 928 | 163 | 2026 |
| Menominee County | 140 | Hard | 827 | 156 | 2022 |
| Marinette County | 123 | Hard | 597 | 61 | 2020 |
| Portage County | 120 | Hard | 717 | 180 | 2026 |
| Dunn County | 110 | Moderately hard | 232 | 65 | 2014 |
| Forest County | 110 | Moderately hard | 526 | 158 | 2025 |
| Langlade County | 110 | Moderately hard | 272 | 81 | 2026 |
| Monroe County | 110 | Moderately hard | 66 | 29 | 2004 |
| Polk County | 95 | Moderately hard | 645 | 116 | 2023 |
| Florence County | 92.3 | Moderately hard | 888 | 43 | 2023 |
| Taylor County | 85 | Moderately hard | 26 | 18 | 2001 |
| Wood County | 79 | Moderately hard | 375 | 189 | 2004 |
| Washburn County | 74.5 | Moderately hard | 114 | 41 | 2026 |
| Clark County | 74 | Moderately hard | 211 | 44 | 2004 |
| Barron County | 72 | Moderately hard | 174 | 83 | 2025 |
| Burnett County | 68 | Moderately hard | 351 | 97 | 2025 |
| Trempealeau County | 68 | Moderately hard | 309 | 45 | 2014 |
| Pepin County | 62.9 | Moderately hard | 318 | 20 | 2016 |
| Ashland County | 62 | Moderately hard | 4,481 | 213 | 2021 |
| Dane County | 61.4 | Moderately hard | 1,840 | 273 | 2020 |
| Juneau County | 60 | Moderately hard | 94 | 24 | 2004 |
| Eau Claire County | 57 | Soft | 220 | 63 | 2014 |
| Iron County | 56 | Soft | 504 | 50 | 2019 |
| Sawyer County | 54 | Soft | 118 | 44 | 2001 |
| Marathon County | 51 | Soft | 134 | 45 | 2026 |
| Chippewa County | 46 | Soft | 450 | 89 | 2013 |
| Rusk County | 46 | Soft | 149 | 63 | 2025 |
| Price County | 45.5 | Soft | 64 | 24 | 2006 |
| Jackson County | 40 | Soft | 232 | 35 | 2003 |
| Vilas County | 38.9 | Soft | 1,777 | 316 | 2026 |
| Oneida County | 35 | Soft | 178 | 71 | 2026 |
| Bayfield County | 23.5 | Soft | 919 | 123 | 2025 |
| Douglas County | 20 | Soft | 1,323 | 145 | 2025 |
| Lincoln County | 13.6 | Soft | 332 | 46 | 2013 |
| 7 additional results from sites without county attribution (not shown). | |||||
ZIP codes
ZIP codes in Wisconsin
The ZIP codes below are grouped by the Wisconsin county each mostly falls within (by land area). Each ZIP takes that county's measured median — shown in the group header — so this is a ZIP-to-county guide, not a separate reading for every ZIP. To check the water system serving a specific address, use the lookup.
Key: a † after a ZIP means it has no mapped community water system — usually a private-well area. Plain ZIPs are served by a mapped community water system.
Iowa County · 390 mg/L · Very hard
53503†53506†53507†53526†53533†53543†53544†53553†53565†53580†53582†
Calumet County · 380 mg/L · Very hard
5301453061†530885411054123†54129†54160†541695491554952†
Lafayette County · 350 mg/L · Very hard
5350453510†53516†5353053541†5358653587†53599†53803†
Kewaunee County · 340 mg/L · Very hard
54201†54205†54216†54217†
Ozaukee County · 340 mg/L · Very hard
53004†53012†53021†5302453074†53080†53092†53097†
Dodge County · 330 mg/L · Very hard
53003†53006†530165303253034†53035†53039†53047†53048†53050†53059†53078†53091†53098†53099†53557†53579†53916†53922†53933†
Fond du Lac County · 330 mg/L · Very hard
53010†53019†53049†53057†53065†53079†53919†539315396354932†54935549375497154974†54979†
Washington County · 320 mg/L · Very hard
53002†53017†530225302753033†5303753040†53076†5308653090†53095
Rock County · 316.5 mg/L · Very hard
53501†53505†53511†53520†53525†53534†53536†535375354553546†53548†5356353576†
Sheboygan County · 315 mg/L · Very hard
53001†53011†53013†53020†53023†53031530445307053073†53075†5308153083†53085†53093†
Green County · 310 mg/L · Very hard
53502†53521†53522†53550†5356653570†53574†
Jefferson County · 310 mg/L · Very hard
53036†5303853094†53137†53156†53178†53538†53549†5355153594†
Manitowoc County · 310 mg/L · Very hard
53015†53042†53063†54207†54214†5421554220†5422754228†54230†5423254241†54245†54247†
Door County · 300 mg/L · Very hard
54202†54204†54209†54210†54211†54212†54213†54234†5423554246†
Grant County · 300 mg/L · Very hard
53554†53569†53573†53801†53802†53804†53805†53806†53807†53808†53809†53810†53811†538125381353816†538175381853820†53825†53827†
Columbia County · 280 mg/L · Very hard
53555†5390153911†53923†53925†53928†53932†5393553954†5395553956†53960†53969
Waukesha County · 275 mg/L · Very hard
530055300753018†53029†5304553046†5305153058†5306653069†5307253089†53103†53118†53119†53122†53127†53146†5314953150†5315153153†53183531865318853189†
Racine County · 274.5 mg/L · Very hard
5310553108†53126†53139†53167†531775318253185†53402†53403534045340553406
Crawford County · 270 mg/L · Very hard
53821†53826†54626†54628†54631†54645†54654†54655†54657†
Richland County · 260 mg/L · Very hard
53518†53540†53556†53581†53584†53924†54664†
Walworth County · 257 mg/L · Very hard
53114†53115†53120†53121†5312553128†53147†5315753176†53184†53190†5319153195†53585†
Vernon County · 250 mg/L · Very hard
54621†54624†54632†54634†54639†54651†54652†54658†54665†54667†
Kenosha County · 241 mg/L · Very hard
53104†5314053142†531435314453158†53168†53170†53179†53181†53192†
Outagamie County · 231 mg/L · Very hard
54106†5411354130541365414054152†5416554170†5491154913†5491454922†54931†5494254944†
Pierce County · 230 mg/L · Very hard
54003†54011†54014†54021†5402254723†54740†54750†54761†54767†
Green Lake County · 222 mg/L · Very hard
53926†53939†53946†53947†54941†54968†
Milwaukee County · 220 mg/L · Very hard
5311053129†53130†531325315453172532025320353204532055320653207†5320853209†5321053211532125321353214532155321653217†53218†5321953220†53221†53222†53223†53224†5322553226†5322753228†5323353235†53295†
Waupaca County · 218.5 mg/L · Very hard
54926†54929†54933†54945†5494654949†54950†54961†54962†54977†54981†54983
Brown County · 198 mg/L · Very hard
54115†54126†54155†54173†54180†54208†54229†543015430254303543045430754311†54313†
Marquette County · 190 mg/L · Very hard
53920†53930†53949†53952†5395353964†54960†
Winnebago County · 190 mg/L · Very hard
5490154902†54904†54927†54947†54956†54963†54964†54980†54985†54986†
Buffalo County · 180 mg/L · Very hard
54610†54622†54629†5475554756†
St. Croix County · 180 mg/L · Very hard
5400254007†54013†54015†54016†5401754023†54025†54027†5402854082†
Sauk County · 180 mg/L · Very hard
53561†53577†53578†53583†5358853913†53937†53940†53941†53942†53943†53951†5395953961†
Waushara County · 180 mg/L · Very hard
54923†54930†54940†54943†54965†54966†54967†54970†5498254984†
Adams County · 160 mg/L · Hard
53910†53934†53936†53965†54457†54613†
Oconto County · 160 mg/L · Hard
54101†54124†54138†54139†54141†54149†54153†54154†54161†54171†54174†54175†
La Crosse County · 150 mg/L · Hard
54601†54603†54614†54623†54636†54644†5465054653†54669†
Shawano County · 144 mg/L · Hard
54107†54111†54127†54128†54137†54162†54166†54414†54416†5445054486†54499†54928†54948†54978†
Menominee County · 140 mg/L · Hard
54135†54150†
Marinette County · 123 mg/L · Hard
54102†54104†54112†54114†54119†54125†54143†54151†54156†54157†54159†54177†
Portage County · 120 mg/L · Hard
54406†54407†54423†54443†54458†54467†54473†54481†54482†54909†54921†
Dunn County · 110 mg/L · Moderately hard
54725†54730†54734†54737†54739†54749†54751†54763†54772†
Forest County · 110 mg/L · Moderately hard
54103†54465†54511†54520†54541†54542†54566†
Langlade County · 110 mg/L · Moderately hard
54409†54418†54424†54428†54430†54462†54464†54485†54491†
Monroe County · 110 mg/L · Moderately hard
54619†54638†54648†54656†5466054666†54670†
Polk County · 95 mg/L · Moderately hard
54001†54005†54006†54009†54020†54024†54026†54810†54824†54826†54837†54853†54858†54889†
Florence County · 92.3 mg/L · Moderately hard
54120†54121†
Taylor County · 85 mg/L · Moderately hard
54433†54447†54451†54470†54480†54490†54766†
Wood County · 79 mg/L · Moderately hard
54410†54412†54413†54441†54449†54454†54466†5446954475†54489†54494†54495†
Washburn County · 74.5 mg/L · Moderately hard
54801†54817†54859†54870†54871†54875†54888†
Clark County · 74 mg/L · Moderately hard
54420†54422†54425†54436†54437†54446†54456†54460†54479†54488†54493†54498†54746†54771†
Barron County · 72 mg/L · Moderately hard
54004†54728†54733†54762†54805†54812†54822†54829†5484154857†54868†
Burnett County · 68 mg/L · Moderately hard
54813†54830†54840†54845†54872†54893†
Trempealeau County · 68 mg/L · Moderately hard
5461254616†54625†54627†54630†54661†54747†54758†5476054770†54773†
Pepin County · 62.9 mg/L · Moderately hard
54721†54736†54759†54769†
Ashland County · 62 mg/L · Moderately hard
54514†54517†54527†54546†54806†54846†54850†54855†54861†
Dane County · 61.4 mg/L · Moderately hard
53508†53515†53517†53523†53527†5352853529†53531†5353253558†53559†53560†53562†53571†53572†5357553589†5359053593†53597535985370353704537055370653711†537135371453715537165371753718537195372653792
Juneau County · 60 mg/L · Moderately hard
53929†53944†53948†53950†5396253968†54618†5463754646†
Eau Claire County · 57 mg/L · Soft
54701†547035472054722†54738†54741†54742
Iron County · 56 mg/L · Soft
54525†54534†54536†54547†54550†54559†54565†
Sawyer County · 54 mg/L · Soft
54828†54835†54843†54862†54867†54876†54896†
Marathon County · 51 mg/L · Soft
5440154403†54405†54408†54411†54417†54421†54426†54427†54440†544485445554471†5447454476†54484
Chippewa County · 46 mg/L · Soft
5472454726†547275472954732†54745†54748†54757†54768
Rusk County · 46 mg/L · Soft
54526†54530†54563†54731†54819†54848†54895†
Price County · 45.5 mg/L · Soft
54459†54513†54515†54524†54537†54552†54555†54556†
Jackson County · 40 mg/L · Soft
54611†54615†54635†54642†54643†54659†54754†
Vilas County · 38.9 mg/L · Soft
54512†54519†5452154538†54540†54545†54554†54557†54558†54560†54561†54568†
Oneida County · 35 mg/L · Soft
54463†54501†54529†54531†54539†54548†54562†54564†
Bayfield County · 23.5 mg/L · Soft
54814†54821†54827†54832†54839†54844†54847†54856†54865†54891†
Douglas County · 20 mg/L · Soft
54820†54836†54838†54842†54849†54854†54864†54873†54874†54880†
Lincoln County · 13.6 mg/L · Soft
54435†54442†54452†54487†
† 629 ZIP codes are not served by a mapped community water system — most are private-well areas. See well water hardness.
Source
Groundwater vs surface water
Wisconsin's groundwater measures harder than its surface water — 210 mg/L across 7,865 samples versus 94.4 across 24,156, about 2.2× harder. Wells draw from groundwater, so well owners in Wisconsin tend to see the harder number — 210 mg/L, very hard. Groundwater readings there run 18.3 to 400 mg/L across the middle 80% of samples. The comparison draws on 3,977 groundwater and 2,360 surface-water monitoring sites; 29 readings above 2,000 mg/L were logged but held out of the medians as outliers.
Groundwater (wells)
210 mg/L as CaCO₃ · 7,865 results at 3,977 stations.
Surface water (rivers, lakes)
94.4 mg/L as CaCO₃ · 24,156 results at 2,360 stations.
Groundwater measures about 2.2× harder than surface water here.
Chemistry
Water chemistry in Wisconsin
Beyond the hardness number, Wisconsin's water carries a fuller chemical signature — here is how its measured parameters compare to national benchmarks.
TDS
96 mg/L · n=8,892
96 mg/L — below the national county median of 226.
pH
7.9 pH · n=46,834
pH 7.9 — within the EPA secondary range of 6.5–8.5, on the alkaline side.
Alkalinity
117 mg/L as CaCO3 · n=5,997
117 mg/L — substantial buffering capacity, which resists pH swings.
Calcium : Magnesium
26.2 : 12.6 mg/L ≈ 2.08 : 1 · n=9,522
Calcium is about 56% of Wisconsin's hardness (26.2 mg/L Ca to 12.6 mg/L Mg), a little more magnesium-rich than the national ~68% calcium share.
Parameter medians may include a small share of quality-control samples; the hardness lane is fully QC-filtered.
Aquifers
Major aquifers under Wisconsin
3 aquifer systems supply much of Wisconsin's measured groundwater.
- Silurian-Devonian aquifers — median 340 mg/L across 615 samples at 438 sites: very hard.
- Cambrian-Ordovician aquifer system — median 280 mg/L across 1,845 samples at 1,056 sites: very hard.
- Sand and gravel aquifers (glaciated regions) — median 120 mg/L across 3,634 samples at 1,672 sites: hard.
Together these systems account for 6,094 measured samples at 3,166 sites. Aquifer medians pool samples across a whole system and can mask local variation — see the national aquifer map for how these compare across states.
Trend
Hardness over time
Wisconsin's decade median moved from 310 mg/L in the 1930s to 125.5 in the 2020s. Over the series, the decade median peaked at 310 mg/L in the 1930s and bottomed at 64 in the 2010s. Decade medians reflect where and what agencies sampled in each era, not just changes in the water itself.
Scale
Where Wisconsin sits on the scale
On the USGS scale, Wisconsin's 110 mg/L is moderately hard — 6.4 grains per gallon, between the 60 and 120 mg/L soft and hard cutoffs.
Questions
Frequently asked questions
- Is Wisconsin's water hard?
- Wisconsin's median hardness is 110 mg/L as CaCO₃, "moderately hard" on the USGS scale and below the national county median of 140 mg/L. About 74% of residents in measured counties have hard-or-worse water.
- Which county in Wisconsin has the hardest water?
- Iowa County, with a median of 390 mg/L as CaCO₃ across 219 measurements.
- Is well water harder than city water in Wisconsin?
- Groundwater measures harder here — about 2.2× the surface water — so wells tend to run harder (groundwater 210 vs surface water 94.4 mg/L).
- How do I find my exact hardness in Wisconsin?
- Search your ZIP on the lookup tool, read your utility's Consumer Confidence Report, or test at home with a kit.
- Is Wisconsin's water harder than the national average?
- No. Wisconsin's median of 110 mg/L is below the national county median of 140 mg/L; it ranks #26 of the 50 states and D.C.
Compare
States with similar hardness
Two states measure closest to Wisconsin's 110 mg/L: District of Columbia at 113 mg/L and Kentucky at 120 mg/L. Wisconsin measures harder than 50% of states. Browse the full ranking on the statistics page.
More: hardness scale · check your address · national statistics · the national map.
By Marko Visic, MPharm, BSc Physics. Source: USGS/EPA Water Quality Portal — 33,134 Wisconsin measurements. Data last verified . Methodology.
Cite this page: “Wisconsin Water Hardness by County.” Hard Water Map. Retrieved 2026-07-22, https://hardwatermap.com/water-hardness/wisconsin/