Florida Water Hardness by County
Water in Florida has a median hardness of 151 mg/L as CaCO₃ — "hard" on the USGS scale — based on 150,764 measurements at 15,636 monitoring stations. Sarasota County has the state's hardest measured water (381 mg/L); Liberty County the softest (11.9). Rank: #19 of the 50 states and D.C.
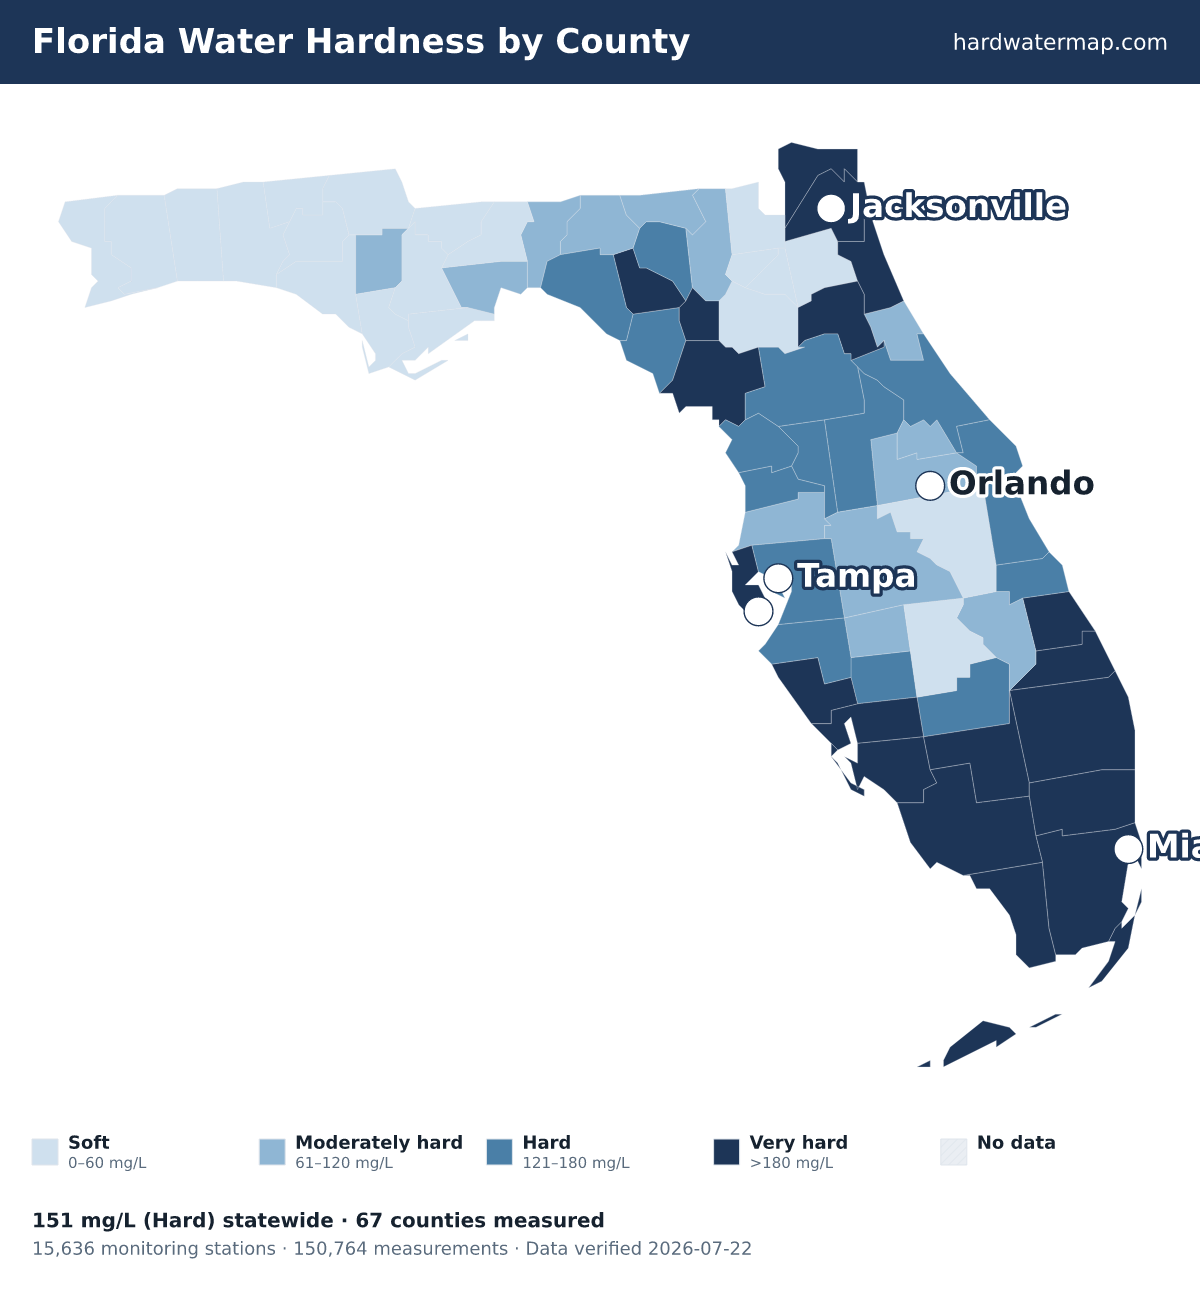
Florida water hardness map — what the numbers mean. Data verified 2026-07-22.
Of Florida's 67 measured counties, 19 very hard, 15 hard, 13 moderately hard, and 20 soft. The hardest are Sarasota County (381 mg/L), Charlotte County (378), and Lee County (288). Liberty County is the softest at 11.9 mg/L (soft).
About 72% of Florida's roughly 21.9 million residents in counties with gate-passing hardness data live where tap water is hard or worse.
Statewide, Florida's median works out to 8.8 grains per gallon and ranks #19 of the 50 states and D.C. Across 150,764 measurements at 15,636 stations — 88,721 of them since 2000 — the middle 80% of readings fall between 29 and 390 mg/L. The public record runs from 1901 to 2025.
See where Florida sits nationally on the national map, or what its number means on the hardness scale.
Download the Florida water hardness map (PNG) — Water hardness by county in Florida: 67 counties mapped from USGS/EPA data, statewide median 151 mg/L (hard); darker counties have harder water.
By county
Water hardness by county
The table lists all 67 measured Florida counties, hardest first. Their medians span 381 mg/L in Sarasota County to 11.9 in Liberty County — a 32× range.
| County | Median | Band | Results | Sites | Newest |
|---|---|---|---|---|---|
| Sarasota County | 381 | Very hard | 2,482 | 798 | 2017 |
| Charlotte County | 378 | Very hard | 281 | 118 | 2019 |
| Lee County | 288 | Very hard | 12,466 | 554 | 2019 |
| St. Lucie County | 280 | Very hard | 1,026 | 255 | 2019 |
| Collier County | 273 | Very hard | 5,468 | 516 | 2019 |
| Duval County | 267 | Very hard | 6,115 | 310 | 2017 |
| Broward County | 250 | Very hard | 3,722 | 525 | 2020 |
| Pinellas County | 250 | Very hard | 2,457 | 651 | 2016 |
| Hendry County | 243 | Very hard | 372 | 236 | 2019 |
| Miami-Dade County | 230 | Very hard | 7,448 | 1,111 | 2023 |
| Nassau County | 219.5 | Very hard | 635 | 51 | 2024 |
| St. Johns County | 209 | Very hard | 4,083 | 120 | 2019 |
| Levy County | 207 | Very hard | 659 | 87 | 2017 |
| Lafayette County | 200.3 | Very hard | 268 | 57 | 2017 |
| Monroe County | 200 | Very hard | 408 | 94 | 2008 |
| Palm Beach County | 200 | Very hard | 6,824 | 964 | 2019 |
| Gilchrist County | 190 | Very hard | 277 | 53 | 2017 |
| Martin County | 190 | Very hard | 1,070 | 333 | 2019 |
| Putnam County | 183 | Very hard | 5,562 | 165 | 2017 |
| Indian River County | 177 | Hard | 6,509 | 141 | 2021 |
| Brevard County | 175 | Hard | 9,528 | 271 | 2019 |
| Dixie County | 160.4 | Hard | 137 | 46 | 2017 |
| Volusia County | 152 | Hard | 3,730 | 172 | 2017 |
| Hillsborough County | 150 | Hard | 5,749 | 1,031 | 2017 |
| Suwannee County | 148 | Hard | 934 | 138 | 2017 |
| Taylor County | 147.6 | Hard | 550 | 54 | 2017 |
| Citrus County | 143 | Hard | 632 | 128 | 2017 |
| Manatee County | 143 | Hard | 1,147 | 354 | 2020 |
| DeSoto County | 140 | Hard | 1,035 | 184 | 2017 |
| Glades County | 140 | Hard | 1,052 | 127 | 2017 |
| Sumter County | 140 | Hard | 340 | 98 | 2017 |
| Hernando County | 139 | Hard | 647 | 163 | 2017 |
| Lake County | 135.9 | Hard | 5,281 | 404 | 2017 |
| Marion County | 132 | Hard | 3,095 | 220 | 2017 |
| Seminole County | 111 | Moderately hard | 3,895 | 210 | 2017 |
| Hardee County | 110 | Moderately hard | 373 | 122 | 2017 |
| Pasco County | 110 | Moderately hard | 1,489 | 284 | 2023 |
| Jefferson County | 94.7 | Moderately hard | 114 | 36 | 2017 |
| Calhoun County | 89 | Moderately hard | 326 | 17 | 2017 |
| Columbia County | 82.3 | Moderately hard | 597 | 114 | 2017 |
| Hamilton County | 74.4 | Moderately hard | 470 | 90 | 2017 |
| Flagler County | 73.4 | Moderately hard | 967 | 39 | 2019 |
| Madison County | 70.1 | Moderately hard | 270 | 65 | 2017 |
| Polk County | 69.7 | Moderately hard | 3,744 | 867 | 2019 |
| Orange County | 68 | Moderately hard | 14,155 | 857 | 2023 |
| Wakulla County | 66.1 | Moderately hard | 989 | 122 | 2023 |
| Okeechobee County | 61 | Moderately hard | 866 | 99 | 2019 |
| Jackson County | 54 | Soft | 463 | 100 | 2025 |
| Osceola County | 51.8 | Soft | 2,831 | 190 | 2023 |
| Clay County | 49.7 | Soft | 3,860 | 125 | 2017 |
| Gulf County | 46.2 | Soft | 76 | 31 | 2016 |
| Franklin County | 45.5 | Soft | 304 | 25 | 2023 |
| Alachua County | 44.5 | Soft | 4,041 | 157 | 2017 |
| Bay County | 44 | Soft | 457 | 108 | 2017 |
| Highlands County | 34 | Soft | 678 | 187 | 2019 |
| Holmes County | 30.8 | Soft | 248 | 19 | 2017 |
| Gadsden County | 29.5 | Soft | 731 | 108 | 2017 |
| Leon County | 29 | Soft | 2,058 | 246 | 2017 |
| Washington County | 28.1 | Soft | 196 | 72 | 2017 |
| Union County | 20 | Soft | 189 | 34 | 2017 |
| Okaloosa County | 18.9 | Soft | 724 | 119 | 2025 |
| Walton County | 18 | Soft | 524 | 106 | 2024 |
| Santa Rosa County | 17 | Soft | 969 | 78 | 2025 |
| Bradford County | 16.9 | Soft | 247 | 47 | 2017 |
| Escambia County | 15.6 | Soft | 1,126 | 367 | 2025 |
| Baker County | 13 | Soft | 528 | 34 | 2019 |
| Liberty County | 11.9 | Soft | 270 | 32 | 2017 |
ZIP codes
ZIP codes in Florida
The ZIP codes below are grouped by the Florida county each mostly falls within (by land area). Each ZIP takes that county's measured median — shown in the group header — so this is a ZIP-to-county guide, not a separate reading for every ZIP. To check the water system serving a specific address, use the lookup.
Key: a † after a ZIP means it has no mapped community water system — usually a private-well area. Plain ZIPs are served by a mapped community water system.
Sarasota County · 381 mg/L · Very hard
342233422834229342313423234233342343423534236†34237342383423934240†34241†3424234275†342853428634287342883428934291†34292†34293†
Charlotte County · 378 mg/L · Very hard
3394633947339483395033952339533395433955339803398133982†3398334224
Lee County · 288 mg/L · Very hard
33901339033390433905†339073390833909†3391233913†339143391633917†3391933920†33921339223392433928†33931†3395633957339653396633967†33971†33972†33973†33974†33976†3399033991†33993†3413434135
St. Lucie County · 280 mg/L · Very hard
34945†34946†3494734949†3495034951†3495234953349813498234983349843498634987†
Collier County · 273 mg/L · Very hard
34101†341023410334104341053410834109341103411234113†34114†3411634117†3411934120†34137†34138†341393414034141†34142†34145†
Duval County · 267 mg/L · Very hard
3220232203322043220532206322073220832209322103221132212322143221632217322183221932220†322213222232223322243222532226†32227322283223332234†322443224632250322543225632257322583226632277
Broward County · 250 mg/L · Very hard
33004330093301933020330213302233023†330243302533026330273302833029330603306233063330643306533066330673306833069330713307333076†333013330433305333063330833309333113331233313333143331533316333173331933321333223332333324333253332633327†3332833330†33331†33332†3333433351333883344133442
Pinellas County · 250 mg/L · Very hard
337013370233703337043370533706337073370833709337103371133712337133371433715†337163374433755337563375933760337613376233763337643376533767337703377133772337733377433776337773377833781337823378533786†346773468134683346843468534688346893469534698
Hendry County · 243 mg/L · Very hard
33440†33930†3393533936†
Miami-Dade County · 230 mg/L · Very hard
33010330123301333014330153301633018†33030†33031†3303233033†33034†33035†33039†3305433055330563310133109331223312533126†331273312833129331303313133132†3313333134331353313633137†3313833139331403314133142331433314433145331463314733149†331503315433155331563315733158331603316133162331653316633167331683316933170†33172331733317433175331763317733178†33179331803318133182331833318433185†3318633187†3318933190†33193†33194†33196†
Nassau County · 219.5 mg/L · Very hard
32009†32011†32034†3204632097†
St. Johns County · 209 mg/L · Very hard
32033†320803208132082†32084320863209232095†32145†32259
Levy County · 207 mg/L · Very hard
32621†32625†32626†32639†32668†32683†32696†34449†34498
Lafayette County · 200.3 mg/L · Very hard
32008†32013†32066†
Monroe County · 200 mg/L · Very hard
33001†33036†33037†33040†33042†33043†33050†33051†33070†
Palm Beach County · 200 mg/L · Very hard
3340133403334043340533406334073340833409334103341133412†3341333414334153341733418†334263342833430†33431334323343333434334353343633437334443344533446†33449†3345833460334613346233463†3346733470†3347233473†33476†3347733478†334803348333484334863348733493†3349633498
Gilchrist County · 190 mg/L · Very hard
32619†32693†
Martin County · 190 mg/L · Very hard
33438†334553346934956†34957†34990†349943499634997†
Putnam County · 183 mg/L · Very hard
32112†32131†32139†32140†32147†3214832157†32177†32181†32187†32189†3219332666†
Indian River County · 177 mg/L · Hard
32948†3295832960329623296332966†329673296832970
Brevard County · 175 mg/L · Hard
32754†32775†32780†32796328993290132903†32904†32905329073290832909†32920†32922329253292632927329313293432935329373294032949†32950†32951†3295232953329553295932976†
Dixie County · 160.4 mg/L · Hard
32359†32628†32648†32680†32692†
Volusia County · 152 mg/L · Hard
321143211732118321193212432127321283212932130†3213232141†321683216932174†321763218032190†32713327203272332724†32725327383274432759†3276332764†
Hillsborough County · 150 mg/L · Hard
33503335103351133527†335303353433547†33548†33549†33550335563355833559†3356333565†3356633567†3356933570335723357333578335793358433592†335943359633598†3360233603336043360533606†3360733609336103361133612336133361433615336163361733618336193362033621†3362433625336263362933634336353363733647
Suwannee County · 148 mg/L · Hard
32060†32062†32064†32071†32094†
Taylor County · 147.6 mg/L · Hard
32336†32347†32348†32356†
Citrus County · 143 mg/L · Hard
34428†3442934433†34434†3443634442†34445†344463444834450†34452†34453†34461†3446534487
Manatee County · 143 mg/L · Hard
342013420234203342053420734208†3420934210342113421234215342163421734219†34221†34222342433425034251†
DeSoto County · 140 mg/L · Hard
34266†34267†34268†34269†
Glades County · 140 mg/L · Hard
33471†33944†34974†
Sumter County · 140 mg/L · Hard
321623216333513†33514†3352133538†3358533597†34484†34785†
Hernando County · 139 mg/L · Hard
3460134602†34604†3460634607†346083460934613†3461434661†
Lake County · 135.9 mg/L · Hard
3210232159†32702†327263273532736†32757†32767†32776†3277834705†34711†34714†347153472934731†34736347373474834753347563476234788†34797†
Marion County · 132 mg/L · Hard
32113†32133†32134†32179†32182†32192†32195†32617†32634†3266432681†32686†32784†3442034431†34432†344703447134472†344733447434475†3447634479†34480†34481†34482†34488†34491
Seminole County · 111 mg/L · Moderately hard
327013270732708327143273032732†32746327503276532766†32771327733277932792
Hardee County · 110 mg/L · Moderately hard
33834†33865†33873†33890†
Pasco County · 110 mg/L · Moderately hard
33523†33525†33540335413354233543†33544335453357433576†34610†34637†34638†34639†3465234653†3465434655346673466834669†34679†3469034691
Jefferson County · 94.7 mg/L · Moderately hard
3233732344†32361
Calhoun County · 89 mg/L · Moderately hard
32421†32424†32430†32449†
Columbia County · 82.3 mg/L · Moderately hard
32024†32025†32038†32055†32061†32096†
Hamilton County · 74.4 mg/L · Moderately hard
32052†32053†
Flagler County · 73.4 mg/L · Moderately hard
32110†32136†3213732164
Madison County · 70.1 mg/L · Moderately hard
32059†32331†3234032350†
Polk County · 69.7 mg/L · Moderately hard
33801338033380533809†33810†338113381233813338153382333827†3383033835†33837†3383833839338403384133843338443384733849†3385033851338533385433855†3385633858†3385933860†33867†33868†33877†33880338813388433897†33898†34759
Orange County · 68 mg/L · Moderately hard
327033270932712327513276832789327983280132803328043280532806328073280832809328103281132812328143281632817328183281932820328213282232824328253282632827328283282932830328313283232833328353283632837328393473434760347613478634787
Wakulla County · 66.1 mg/L · Moderately hard
3232732346†3235532358†
Okeechobee County · 61 mg/L · Moderately hard
34972†
Jackson County · 54 mg/L · Soft
32420†32423†32426†32431†32432†32440†32442†32443†32445†32446†32448†32460†
Osceola County · 51.8 mg/L · Soft
3384833896†3473934741347433474434746347473475834769347713477234773
Clay County · 49.7 mg/L · Soft
32003320433206532068†320733207932656†
Gulf County · 46.2 mg/L · Soft
3245632465†
Franklin County · 45.5 mg/L · Soft
32320†32322†32323†32328†
Alachua County · 44.5 mg/L · Soft
326013260332605326063260732608†32609†326103261232615†326163261832631†32640†32641†32643†32653†32658†32667†32669†32694†
Bay County · 44 mg/L · Soft
32401†32403†32404†3240532407†3240832409†3241032413†32438†3244432466†
Highlands County · 34 mg/L · Soft
33825†3385233857†33870†33872†33875†33876†33960†
Holmes County · 30.8 mg/L · Soft
32425†32464†
Gadsden County · 29.5 mg/L · Soft
32324†32330†32332†32333†32343†3235132352†
Leon County · 29 mg/L · Soft
323013230332304†32305†32306323073230832309†32310†32311†323123231332317†32399†
Washington County · 28.1 mg/L · Soft
32427†32428†32437†32462†32463
Union County · 20 mg/L · Soft
32054†32083†32697†
Okaloosa County · 18.9 mg/L · Soft
32531†32536†325393254132542†32544†325473254832567†32569†32578†3257932580†
Walton County · 18 mg/L · Soft
32433†324353243932455†32459†32461†32550†
Santa Rosa County · 17 mg/L · Soft
32530†32563†32564†32565†3256632570†32571†32583
Bradford County · 16.9 mg/L · Soft
32026†32044†32058†32091†32622†
Escambia County · 15.6 mg/L · Soft
32501325023250332504325053250632507†32508†32509†32511325123251432526†325333253432535†32561†32568†32577†
Baker County · 13 mg/L · Soft
32040†3206332072†32087†
Liberty County · 11.9 mg/L · Soft
32321†32334†32360
† 395 ZIP codes are not served by a mapped community water system — most are private-well areas. See well water hardness.
Source
Groundwater vs surface water
Florida's groundwater measures harder than its surface water — 260 mg/L across 23,914 samples versus 136 across 125,249, about 1.9× harder. Wells draw from groundwater, so well owners in Florida tend to see the harder number — 260 mg/L, very hard. Groundwater readings there run 69.2 to 580 mg/L across the middle 80% of samples. The comparison draws on 7,431 groundwater and 7,998 surface-water monitoring sites; 6,106 readings above 2,000 mg/L were logged but held out of the medians as outliers.
Groundwater (wells)
260 mg/L as CaCO₃ · 23,914 results at 7,431 stations.
Surface water (rivers, lakes)
136 mg/L as CaCO₃ · 125,249 results at 7,998 stations.
Groundwater measures about 1.9× harder than surface water here.
Chemistry
Water chemistry in Florida
Beyond the hardness number, Florida's water carries a fuller chemical signature — here is how its measured parameters compare to national benchmarks.
TDS
191 mg/L · n=41,736
191 mg/L — below the national county median of 226.
pH
7.3 pH · n=79,253
pH 7.3 — within the EPA secondary range of 6.5–8.5, on the alkaline side.
Alkalinity
63.2 mg/L as CaCO3 · n=95,910
63.2 mg/L — modest buffering capacity.
Calcium : Magnesium
42 : 7.8 mg/L ≈ 5.38 : 1 · n=124,509
Calcium is about 77% of Florida's hardness (42 mg/L Ca to 7.8 mg/L Mg), a little more calcium-rich than the national ~68% calcium share.
Parameter medians may include a small share of quality-control samples; the hardness lane is fully QC-filtered.
Aquifers
Major aquifers under Florida
3 aquifer systems supply much of Florida's measured groundwater.
- Intermediate aquifer system — median 370 mg/L across 1,432 samples at 653 sites: very hard.
- Biscayne aquifer — median 267 mg/L across 1,301 samples at 483 sites: very hard.
- Floridan aquifer system — median 250 mg/L across 8,915 samples at 2,165 sites: very hard.
Together these systems account for 11,648 measured samples at 3,301 sites. Aquifer medians pool samples across a whole system and can mask local variation — see the national aquifer map for how these compare across states.
Trend
Hardness over time
Florida's decade median moved from 230 mg/L in the 1920s to 86.9 in the 2020s. Over the series, the decade median peaked at 270 mg/L in the 1930s and bottomed at 86.9 in the 2020s. Decade medians reflect where and what agencies sampled in each era, not just changes in the water itself.
Scale
Where Florida sits on the scale
On the USGS scale, Florida's 151 mg/L is hard — 8.8 grains per gallon, above the 120 mg/L hard cutoff, below very hard.
At 151 mg/L (8.8 gpg), water-softener owners in Florida typically set their unit to this hardness — settings calculator.
Questions
Frequently asked questions
- Is Florida's water hard?
- Florida's median hardness is 151 mg/L as CaCO₃, "hard" on the USGS scale and 1.08× the national county median of 140 mg/L. About 72% of residents in measured counties have hard-or-worse water.
- Which county in Florida has the hardest water?
- Sarasota County, with a median of 381 mg/L as CaCO₃ across 2,482 measurements.
- Is well water harder than city water in Florida?
- Groundwater measures harder here — about 1.9× the surface water — so wells tend to run harder (groundwater 260 vs surface water 136 mg/L).
- How do I find my exact hardness in Florida?
- Search your ZIP on the lookup tool, read your utility's Consumer Confidence Report, or test at home with a kit.
- Is Florida's water harder than the national average?
- Yes. Florida's median of 151 mg/L is 1.08× the national county median of 140 mg/L, and Florida ranks #19 of the 50 states and D.C.
Compare
States with similar hardness
Two states measure closest to Florida's 151 mg/L: California at 150 mg/L and Nevada at 150 mg/L. Florida measures harder than 64% of states. Browse the full ranking on the statistics page.
More: hardness scale · check your address · national statistics · the national map.
By Marko Visic, MPharm, BSc Physics. Source: USGS/EPA Water Quality Portal — 150,764 Florida measurements. Data last verified . Methodology.
Cite this page: “Florida Water Hardness by County.” Hard Water Map. Retrieved 2026-07-22, https://hardwatermap.com/water-hardness/florida/