Nevada Water Hardness by County
Water in Nevada has a median hardness of 150 mg/L as CaCO₃ — "hard" on the USGS scale — based on 22,166 measurements at 3,755 monitoring stations. Mineral County has the state's hardest measured water (644 mg/L); Esmeralda County the softest (21.1). Rank: #21 of the 50 states and D.C.
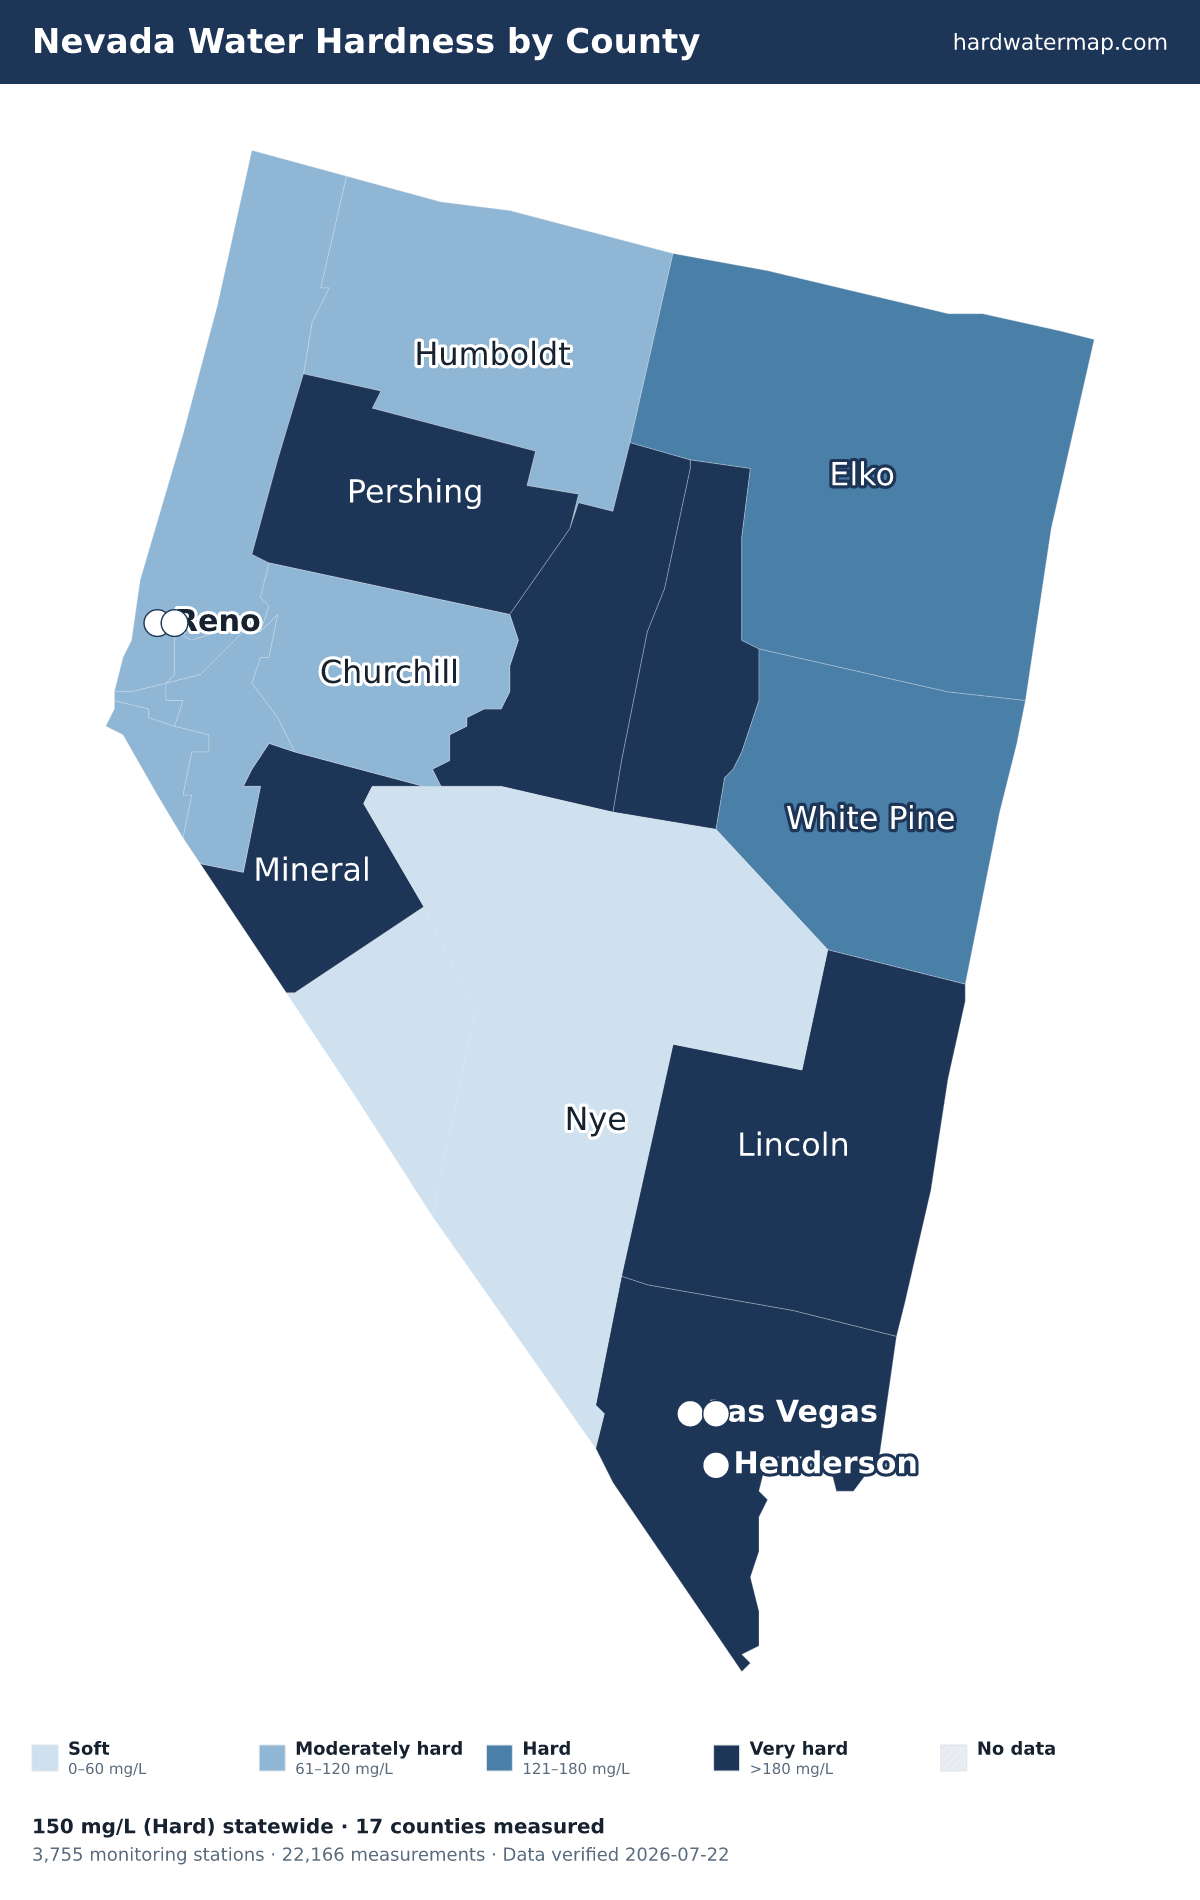
Nevada water hardness map — what the numbers mean. Data verified 2026-07-22.
Of Nevada's 17 measured counties, 6 very hard, 2 hard, 7 moderately hard, and 2 soft. The hardest are Mineral County (644 mg/L), Clark County (340), and Eureka County (188). Esmeralda County is the softest at 21.1 mg/L (soft).
About 76% of Nevada's roughly 3.1 million residents in counties with gate-passing hardness data live where tap water is hard or worse.
Statewide, Nevada's median works out to 8.8 grains per gallon and ranks #21 of the 50 states and D.C. Across 22,166 measurements at 3,755 stations — 10,908 of them since 2000 — the middle 80% of readings fall between 35 and 473 mg/L. The public record runs from 1934 to 2023.
See where Nevada sits nationally on the national map, or what its number means on the hardness scale.
Download the Nevada water hardness map (PNG) — Water hardness by county in Nevada: 17 counties mapped from USGS/EPA data, statewide median 150 mg/L (hard); darker counties have harder water.
By county
Water hardness by county
The table lists all 17 measured Nevada counties, hardest first. Their medians span 644 mg/L in Mineral County to 21.1 in Esmeralda County — a 30.5× range.
| County | Median | Band | Results | Sites | Newest |
|---|---|---|---|---|---|
| Mineral County | 644 | Very hard | 1,085 | 91 | 2023 |
| Clark County | 340 | Very hard | 4,317 | 363 | 2022 |
| Eureka County | 188 | Very hard | 518 | 104 | 2022 |
| Lander County | 187 | Very hard | 238 | 75 | 2013 |
| Lincoln County | 184 | Very hard | 198 | 94 | 2021 |
| Pershing County | 182 | Very hard | 983 | 157 | 2017 |
| White Pine County | 170 | Hard | 876 | 257 | 2022 |
| Elko County | 133 | Hard | 1,825 | 235 | 2023 |
| Lyon County | 108 | Moderately hard | 1,639 | 190 | 2014 |
| Humboldt County | 107 | Moderately hard | 689 | 366 | 2020 |
| Storey County | 107 | Moderately hard | 149 | 40 | 2020 |
| Churchill County | 96.1 | Moderately hard | 1,630 | 548 | 2023 |
| Carson City County | 87 | Moderately hard | 593 | 116 | 2023 |
| Douglas County | 86.8 | Moderately hard | 2,298 | 275 | 2023 |
| Washoe County | 78.7 | Moderately hard | 3,893 | 415 | 2023 |
| Nye County | 54 | Soft | 1,122 | 416 | 2022 |
| Esmeralda County | 21.1 | Soft | 113 | 13 | 2021 |
ZIP codes
ZIP codes in Nevada
The ZIP codes below are grouped by the Nevada county each mostly falls within (by land area). Each ZIP takes that county's measured median — shown in the group header — so this is a ZIP-to-county guide, not a separate reading for every ZIP. To check the water system serving a specific address, use the lookup.
Key: a † after a ZIP means it has no mapped community water system — usually a private-well area. Plain ZIPs are served by a mapped community water system.
Mineral County · 644 mg/L · Very hard
89415†89420†89422†89427†
Clark County · 340 mg/L · Very hard
8900289004†89005†89007†89011890128901489015†89018†89019†89021†89025†89026†890278902989030890318903289034†89039†89040†89044†89046†8905289054†89070†890748908189084890858908689101891028910389104891068910789108891098911089113891158911789118891198912089121891228912389124†891288912989130891318913489135†891388913989141891428914389144891458914689147891488914989156†8915889161†89166†8916989178†89179†8918389191
Eureka County · 188 mg/L · Very hard
89316†89821†89822†
Lander County · 187 mg/L · Very hard
89310†89820†
Lincoln County · 184 mg/L · Very hard
89001†89008†89017†89042†89043†
Pershing County · 182 mg/L · Very hard
89418†89419†
White Pine County · 170 mg/L · Hard
89301†89311†89315†89317†89318†89319
Elko County · 133 mg/L · Hard
89801†89815†89823†89825†89826†89828†89830†89831†89832†89833†89834†89835†89883†
Lyon County · 108 mg/L · Moderately hard
89403†89428†89429†89430†89444†89447†
Humboldt County · 107 mg/L · Moderately hard
89404†89414†89425†89426†89438†89445†89446†
Storey County · 107 mg/L · Moderately hard
89434†89437†89440†
Churchill County · 96.1 mg/L · Moderately hard
89406†89408†89496†
Carson City County · 87 mg/L · Moderately hard
89701†89703†89706†
Douglas County · 86.8 mg/L · Moderately hard
89410†89411†89413†89423†8944889449†89460†89705†
Washoe County · 78.7 mg/L · Moderately hard
8940289405†89412†89424†8943189433894368943989441†89442†894508945189501895028950389506†89508†8950989510†89511†895128951989521†895238955789704†
Nye County · 54 mg/L · Soft
89003†89020†89022†89045†8904889049†89060†89061†89314†89409†
Esmeralda County · 21.1 mg/L · Soft
89010†89013†89047†
† 109 ZIP codes are not served by a mapped community water system — most are private-well areas. See well water hardness.
Source
Groundwater vs surface water
Nevada's surface water measures harder than its groundwater — 158 mg/L across 17,526 samples versus 127 across 4,425, about 1.2× harder. For well owners that is the better side of a hard bargain: at 127 mg/L, Nevada groundwater is still hard, and most of the state's drinking water is pumped from it. Groundwater readings there run 16.6 to 408.4 mg/L across the middle 80% of samples. The comparison draws on 2,035 groundwater and 1,682 surface-water monitoring sites; 179 readings above 2,000 mg/L were logged but held out of the medians as outliers.
Groundwater (wells)
127 mg/L as CaCO₃ · 4,425 results at 2,035 stations.
Surface water (rivers, lakes)
158 mg/L as CaCO₃ · 17,526 results at 1,682 stations.
Surface water measures about 1.2× harder than groundwater here.
Chemistry
Water chemistry in Nevada
Beyond the hardness number, Nevada's water carries a fuller chemical signature — here is how its measured parameters compare to national benchmarks.
TDS
206 mg/L · n=7,228
206 mg/L — below the national county median of 226.
pH
9.4 pH · n=4,311
pH 9.4 — outside the EPA secondary range of 6.5–8.5, on the alkaline side.
Alkalinity
97 mg/L as CaCO3 · n=20,025
97 mg/L — modest buffering capacity.
Calcium : Magnesium
24 : 9 mg/L ≈ 2.67 : 1 · n=14,455
Calcium is about 62% of Nevada's hardness (24 mg/L Ca to 9 mg/L Mg), a little more magnesium-rich than the national ~68% calcium share.
Parameter medians may include a small share of quality-control samples; the hardness lane is fully QC-filtered.
Aquifers
Major aquifers under Nevada
3 aquifer systems supply much of Nevada's measured groundwater.
- Basin and Range carbonate-rock aquifers — median 220 mg/L across 218 samples at 101 sites: very hard.
- Basin and Range basin-fill aquifers — median 116 mg/L across 1,902 samples at 501 sites: moderately hard.
- Southern Nevada volcanic-rock aquifers — median 36.1 mg/L across 36 samples at 15 sites: soft.
Together these systems account for 2,156 measured samples at 617 sites. Aquifer medians pool samples across a whole system and can mask local variation — see the national aquifer map for how these compare across states.
Trend
Hardness over time
Nevada's decade median moved from 310 mg/L in the 1950s to 87.3 in the 2020s. Over the series, the decade median peaked at 320 mg/L in the 1970s and bottomed at 87.3 in the 2020s. Decade medians reflect where and what agencies sampled in each era, not just changes in the water itself.
Scale
Where Nevada sits on the scale
On the USGS scale, Nevada's 150 mg/L is hard — 8.8 grains per gallon, above the 120 mg/L hard cutoff, below very hard.
At 150 mg/L (8.8 gpg), water-softener owners in Nevada typically set their unit to this hardness — settings calculator.
Questions
Frequently asked questions
- Is Nevada's water hard?
- Nevada's median hardness is 150 mg/L as CaCO₃, "hard" on the USGS scale and 1.07× the national county median of 140 mg/L. About 76% of residents in measured counties have hard-or-worse water.
- Which county in Nevada has the hardest water?
- Mineral County, with a median of 644 mg/L as CaCO₃ across 1,085 measurements.
- Is well water harder than city water in Nevada?
- Surface water measures harder here — about 1.2× the groundwater — so wells tend to run softer (groundwater 127 vs surface water 158 mg/L).
- How do I find my exact hardness in Nevada?
- Search your ZIP on the lookup tool, read your utility's Consumer Confidence Report, or test at home with a kit.
- Is Nevada's water harder than the national average?
- Yes. Nevada's median of 150 mg/L is 1.07× the national county median of 140 mg/L, and Nevada ranks #21 of the 50 states and D.C.
Compare
States with similar hardness
Two states measure closest to Nevada's 150 mg/L: California at 150 mg/L and Florida at 151 mg/L. Nevada measures harder than 60% of states. Browse the full ranking on the statistics page.
More: hardness scale · check your address · national statistics · the national map.
By Marko Visic, MPharm, BSc Physics. Source: USGS/EPA Water Quality Portal — 22,166 Nevada measurements. Data last verified . Methodology.
Cite this page: “Nevada Water Hardness by County.” Hard Water Map. Retrieved 2026-07-22, https://hardwatermap.com/water-hardness/nevada/