Colorado Water Hardness by County
Water in Colorado has a median hardness of 157 mg/L as CaCO₃ — "hard" on the USGS scale — based on 218,893 measurements at 18,406 monitoring stations. Prowers County has the state's hardest measured water (1300 mg/L); Larimer County the softest (18). Rank: #18 of the 50 states and D.C.
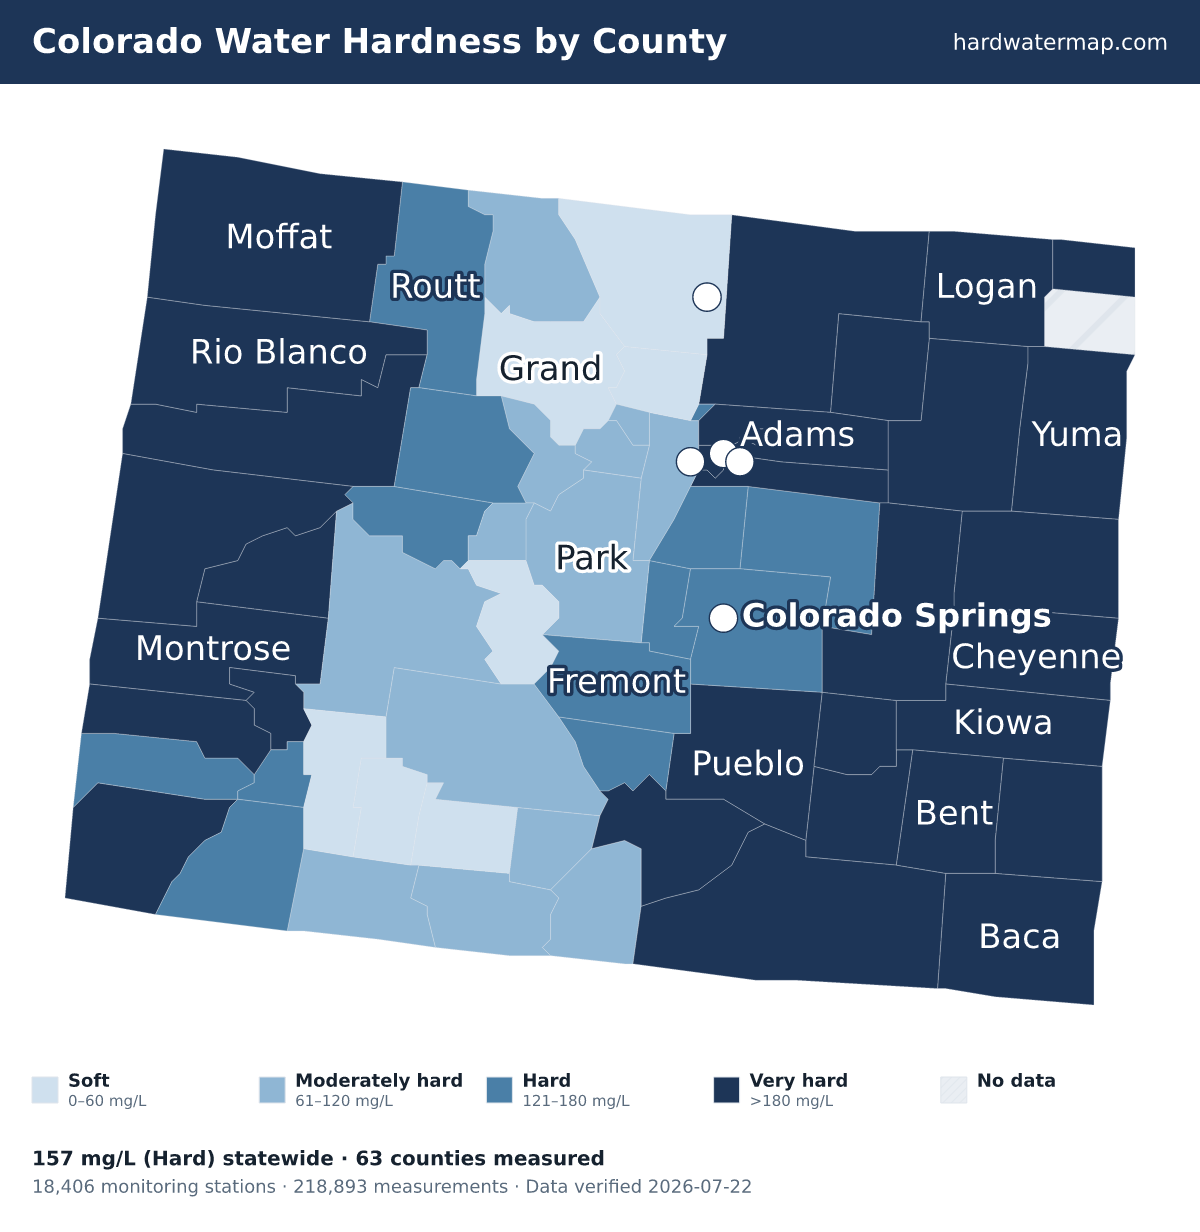
Colorado water hardness map — what the numbers mean. Data verified 2026-07-22.
Of Colorado's 63 measured counties, 30 very hard, 13 hard, 13 moderately hard, and 7 soft. The hardest are Prowers County (1300 mg/L), Bent County (980), and Kiowa County (710). Larimer County is the softest at 18 mg/L (soft).
About 75% of Colorado's roughly 5.8 million residents in counties with gate-passing hardness data live where tap water is hard or worse.
Statewide, Colorado's median works out to 9.2 grains per gallon and ranks #18 of the 50 states and D.C. Across 218,893 measurements at 18,406 stations — 108,828 of them since 2000 — the middle 80% of readings fall between 20.1 and 628 mg/L. The public record runs from 1900 to 2026.
See where Colorado sits nationally on the national map, or what its number means on the hardness scale.
Download the Colorado water hardness map (PNG) — Water hardness by county in Colorado: 63 counties mapped from USGS/EPA data, statewide median 157 mg/L (hard); darker counties have harder water.
By county
Water hardness by county
The table lists all 63 measured Colorado counties, hardest first. Their medians span 1300 mg/L in Prowers County to 18 in Larimer County — a 72.2× range. 1 more Colorado county lacks gate-passing data.
| County | Median | Band | Results | Sites | Newest |
|---|---|---|---|---|---|
| Prowers County | 1300 | Very hard | 881 | 179 | 2026 |
| Bent County | 980 | Very hard | 2,020 | 145 | 2025 |
| Kiowa County | 710 | Very hard | 155 | 80 | 2025 |
| Sedgwick County | 683 | Very hard | 644 | 32 | 2023 |
| Otero County | 660 | Very hard | 2,310 | 188 | 2023 |
| Logan County | 656 | Very hard | 855 | 67 | 2026 |
| Cheyenne County | 642 | Very hard | 111 | 37 | 2015 |
| Morgan County | 570 | Very hard | 1,791 | 70 | 2024 |
| Weld County | 550 | Very hard | 8,275 | 682 | 2026 |
| Crowley County | 480.5 | Very hard | 177 | 76 | 2023 |
| Delta County | 382 | Very hard | 5,561 | 406 | 2026 |
| Washington County | 370 | Very hard | 68 | 32 | 2023 |
| Montezuma County | 332 | Very hard | 4,789 | 514 | 2025 |
| Mesa County | 310 | Very hard | 8,948 | 639 | 2026 |
| Pueblo County | 299 | Very hard | 4,654 | 424 | 2026 |
| Montrose County | 290 | Very hard | 5,718 | 397 | 2025 |
| Rio Blanco County | 288 | Very hard | 7,514 | 639 | 2026 |
| Baca County | 279 | Very hard | 266 | 192 | 2023 |
| Denver County | 256 | Very hard | 2,497 | 173 | 2026 |
| Lincoln County | 256 | Very hard | 40 | 21 | 2018 |
| Arapahoe County | 238 | Very hard | 4,697 | 393 | 2025 |
| Ouray County | 236.5 | Very hard | 3,945 | 204 | 2026 |
| Adams County | 228 | Very hard | 7,235 | 333 | 2026 |
| Las Animas County | 225 | Very hard | 1,836 | 215 | 2026 |
| Huerfano County | 220 | Very hard | 863 | 81 | 2023 |
| Garfield County | 210 | Very hard | 9,731 | 627 | 2026 |
| San Miguel County | 190 | Very hard | 3,164 | 167 | 2025 |
| Kit Carson County | 185 | Very hard | 122 | 29 | 2021 |
| Moffat County | 180 | Very hard | 4,806 | 373 | 2026 |
| Yuma County | 180 | Very hard | 836 | 90 | 2024 |
| Pitkin County | 170 | Hard | 3,254 | 200 | 2025 |
| La Plata County | 160 | Hard | 8,833 | 624 | 2026 |
| El Paso County | 156 | Hard | 6,620 | 830 | 2025 |
| Broomfield County | 150 | Hard | 9 | 5 | 1999 |
| Custer County | 140 | Hard | 435 | 90 | 2025 |
| Fremont County | 140 | Hard | 1,946 | 208 | 2025 |
| Routt County | 140 | Hard | 5,408 | 576 | 2026 |
| Eagle County | 138 | Hard | 8,234 | 465 | 2026 |
| Elbert County | 134 | Hard | 479 | 87 | 2024 |
| Teller County | 134 | Hard | 766 | 98 | 2026 |
| San Juan County | 128.5 | Hard | 3,994 | 307 | 2026 |
| Dolores County | 120 | Hard | 365 | 113 | 2024 |
| Douglas County | 120 | Hard | 1,785 | 337 | 2025 |
| Jefferson County | 110 | Moderately hard | 4,332 | 613 | 2025 |
| Park County | 100 | Moderately hard | 2,487 | 654 | 2025 |
| Lake County | 90.1 | Moderately hard | 5,417 | 491 | 2026 |
| Gilpin County | 90 | Moderately hard | 972 | 115 | 2022 |
| Conejos County | 88 | Moderately hard | 3,005 | 216 | 2025 |
| Jackson County | 88 | Moderately hard | 2,065 | 224 | 2026 |
| Costilla County | 86 | Moderately hard | 599 | 78 | 2025 |
| Summit County | 80 | Moderately hard | 3,071 | 393 | 2026 |
| Gunnison County | 77.2 | Moderately hard | 7,951 | 706 | 2026 |
| Alamosa County | 72 | Moderately hard | 903 | 172 | 2026 |
| Archuleta County | 68.5 | Moderately hard | 2,014 | 216 | 2026 |
| Clear Creek County | 68.3 | Moderately hard | 5,357 | 521 | 2025 |
| Saguache County | 62 | Moderately hard | 1,327 | 287 | 2025 |
| Chaffee County | 58 | Soft | 2,810 | 266 | 2025 |
| Hinsdale County | 57.9 | Soft | 752 | 209 | 2025 |
| Boulder County | 46 | Soft | 6,913 | 484 | 2026 |
| Rio Grande County | 44 | Soft | 1,873 | 166 | 2025 |
| Grand County | 41.7 | Soft | 8,360 | 350 | 2026 |
| Mineral County | 31 | Soft | 1,196 | 175 | 2026 |
| Larimer County | 18 | Soft | 20,839 | 616 | 2026 |
ZIP codes
ZIP codes in Colorado
The ZIP codes below are grouped by the Colorado county each mostly falls within (by land area). Each ZIP takes that county's measured median — shown in the group header — so this is a ZIP-to-county guide, not a separate reading for every ZIP. To check the water system serving a specific address, use the lookup.
Key: a † after a ZIP means it has no mapped community water system — usually a private-well area. Plain ZIPs are served by a mapped community water system.
Prowers County · 1300 mg/L · Very hard
81041†8104381047†81052†
Bent County · 980 mg/L · Very hard
81044†81054†81057†81092†
Kiowa County · 710 mg/L · Very hard
81021†81036†81045†81071†
Sedgwick County · 683 mg/L · Very hard
80737†80744†80749†
Otero County · 660 mg/L · Very hard
81030†81050†81058†81067†81077†
Logan County · 656 mg/L · Very hard
80722†80726†80728†80736†80741†80745†80747†80751†
Cheyenne County · 642 mg/L · Very hard
80802†80810†80825†80862†
Morgan County · 570 mg/L · Very hard
80653†80654†80701†8070580723†80733†80750†
Weld County · 550 mg/L · Very hard
80504805148051680520†805308053480542†80543805468055080610†80611†80612†806158062080621†80622†80623†80624†806318063480642†80643†8064480645†8064680648†80649†806508065180652†80729†80732†80742†80754†
Crowley County · 480.5 mg/L · Very hard
81033†81062†81063†81076†
Delta County · 382 mg/L · Very hard
8141081413†8141681418†81419†81428†
Washington County · 370 mg/L · Very hard
80720†80740†80743†80757†80801†80812†
Montezuma County · 332 mg/L · Very hard
81321†81327†81328†81330†81331†81334†81335†
Mesa County · 310 mg/L · Very hard
815018150381504†81505†81506†81507†8152081521†81522†81523†81524†81525†81526†81527†81624†81643†81646†
Pueblo County · 299 mg/L · Very hard
81001†8100381004†81005†8100681007†81008†8101981022†81023†81025†81039†
Montrose County · 290 mg/L · Very hard
81401†8140381411†81415†81422†81424†8142581429†
Rio Blanco County · 288 mg/L · Very hard
81641†81648†81650†
Baca County · 279 mg/L · Very hard
81029†81064†81073†81084†81087†81090†
Denver County · 256 mg/L · Very hard
80202802038020480205802068020780209802108021180212802168021880219802208022280223802248023080231802368023780238802398024680247802498026480266802908029380294
Lincoln County · 256 mg/L · Very hard
80804†80818†80821†80823†80826†80828†80833†
Arapahoe County · 238 mg/L · Very hard
8001080012800138001480015800168001780018†80105†80110†8011180112†8011380120801218012280137†
Ouray County · 236.5 mg/L · Very hard
8142781432
Adams County · 228 mg/L · Very hard
80011†80019†800228002480030800318004580102†80103†80136†80221802298023380234802418026080601806028060380640
Las Animas County · 225 mg/L · Very hard
81020†81024†81027†81046†81049†81059†81081†81082†81091†
Huerfano County · 220 mg/L · Very hard
81040†81055†81069†81089†
Garfield County · 210 mg/L · Very hard
81601†81630†81635†81637†8164781652†
San Miguel County · 190 mg/L · Very hard
81423†81426†81430†81431†81435†
Kit Carson County · 185 mg/L · Very hard
80805†80807†80815†80834†80836†80861†
Moffat County · 180 mg/L · Very hard
81610†81625†81633†81638†81640†
Yuma County · 180 mg/L · Very hard
80727†80735†80755†80758†80759†80822†80824†
Pitkin County · 170 mg/L · Hard
81611†81612†8161581623†81642†81654†81656†
La Plata County · 160 mg/L · Hard
81122†81137†81301†81303†81326†
El Paso County · 156 mg/L · Hard
801328013380808†80809†8081780819†80829†80831†80840†80864†80902†80903809048090580906†8090780908†80909809108091180913†8091480915809168091780918809198092080921†8092280923809248092580926†8092780928†80929†80930†809388093980951
Broomfield County · 150 mg/L · Hard
8002080023†
Custer County · 140 mg/L · Hard
81252†81253†
Fremont County · 140 mg/L · Hard
81212†8122181222†81223†81226†81232†81233†81240†81244
Routt County · 140 mg/L · Hard
80428†80463†80467†80469†80479†80483†80487†81639†81653†
Eagle County · 138 mg/L · Hard
80423†80426†81620†81621†81631†81632†81645†81649†81655†81657†
Elbert County · 134 mg/L · Hard
80101†80106†80107†80117†80830†80832†80835†
Teller County · 134 mg/L · Hard
80813†80814†80816†80860†80863†
San Juan County · 128.5 mg/L · Hard
81433†
Dolores County · 120 mg/L · Hard
81320†81323†81324†81325†81332†
Douglas County · 120 mg/L · Hard
80104†80108†80109†80116†80118†8012480125801268012980130801318013480135†80138†
Jefferson County · 110 mg/L · Moderately hard
80002800038000480005800078002180033†8012380127†80128†8021480215802268022780228802328023580401†80403†8041980425†80433†80453†8045480457†80465†80470†
Park County · 100 mg/L · Moderately hard
80420†80421†80432†80440†80448†80449†80456†80475†80820†80827†
Lake County · 90.1 mg/L · Moderately hard
80461†81251†
Gilpin County · 90 mg/L · Moderately hard
80422†80427†80474†
Conejos County · 88 mg/L · Moderately hard
81120†8112481129†81140†81141†81148
Jackson County · 88 mg/L · Moderately hard
80430†80434†80473†80480†
Costilla County · 86 mg/L · Moderately hard
81123†81126†81133†81138†81151†81152†
Summit County · 80 mg/L · Moderately hard
80424†80435†80443†80498†
Gunnison County · 77.2 mg/L · Moderately hard
81210†81220†81224†81225†81230†81237†81239†81241†81243†81434†
Alamosa County · 72 mg/L · Moderately hard
8110181136†81146†
Archuleta County · 68.5 mg/L · Moderately hard
8112181128†81147
Clear Creek County · 68.3 mg/L · Moderately hard
80436†80438†80439†80444†80452†80476†
Saguache County · 62 mg/L · Moderately hard
81125†81131†81143†81149†81155†81248†
Chaffee County · 58 mg/L · Soft
81201†81211†81227†81228†81236†81242†
Hinsdale County · 57.9 mg/L · Soft
81235†
Boulder County · 46 mg/L · Soft
80025†800268002780301†80302†80303†80304803058031080455†80466†80471†80481†805018050380510†80540†80544
Rio Grande County · 44 mg/L · Soft
81132†81144†81154†
Grand County · 41.7 mg/L · Soft
80442†80446†80447†80451†80459†80468†80478†80482
Mineral County · 31 mg/L · Soft
81130†
Larimer County · 18 mg/L · Soft
80512†8051380515†80517†80521805248052580526†8052880532†80535†80536†8053780538†80545†8054780549†82063†
† 362 ZIP codes are not served by a mapped community water system — most are private-well areas. See well water hardness.
Source
Groundwater vs surface water
Colorado's groundwater measures harder than its surface water — 280 mg/L across 12,763 samples versus 152 across 200,519, about 1.8× harder. Wells draw from groundwater, so well owners in Colorado tend to see the harder number — 280 mg/L, very hard. Groundwater readings there run 27 to 1100 mg/L across the middle 80% of samples. The comparison draws on 6,156 groundwater and 11,719 surface-water monitoring sites; 2,761 readings above 2,000 mg/L were logged but held out of the medians as outliers.
Groundwater (wells)
280 mg/L as CaCO₃ · 12,763 results at 6,156 stations.
Surface water (rivers, lakes)
152 mg/L as CaCO₃ · 200,519 results at 11,719 stations.
Groundwater measures about 1.8× harder than surface water here.
Chemistry
Water chemistry in Colorado
Beyond the hardness number, Colorado's water carries a fuller chemical signature — here is how its measured parameters compare to national benchmarks.
TDS
228 mg/L · n=19,790
228 mg/L — about 1× the national county median of 226, consistent with hard, mineral-rich water.
pH
7.9 pH · n=62,710
pH 7.9 — within the EPA secondary range of 6.5–8.5, on the alkaline side.
Alkalinity
92 mg/L as CaCO3 · n=100,693
92 mg/L — modest buffering capacity.
Calcium : Magnesium
38.6 : 7.4 mg/L ≈ 5.22 : 1 · n=137,561
Calcium is about 76% of Colorado's hardness (38.6 mg/L Ca to 7.4 mg/L Mg), a little more calcium-rich than the national ~68% calcium share.
Parameter medians may include a small share of quality-control samples; the hardness lane is fully QC-filtered.
Aquifers
Major aquifers under Colorado
3 aquifer systems supply much of Colorado's measured groundwater.
- Alluvial aquifers — median 328 mg/L across 752 samples at 326 sites: very hard.
- Colorado Plateaus aquifers — median 240 mg/L across 989 samples at 624 sites: very hard.
- High Plains (Ogallala) aquifer — median 160 mg/L across 197 samples at 156 sites: hard.
Together these systems account for 1,938 measured samples at 1,106 sites. Aquifer medians pool samples across a whole system and can mask local variation — see the national aquifer map for how these compare across states.
Trend
Hardness over time
Colorado's decade median moved from 560 mg/L in the 1930s to 156 in the 2020s. Over the series, the decade median peaked at 560 mg/L in the 1930s and bottomed at 126 in the 2010s. Decade medians reflect where and what agencies sampled in each era, not just changes in the water itself.
Scale
Where Colorado sits on the scale
On the USGS scale, Colorado's 157 mg/L is hard — 9.2 grains per gallon, above the 120 mg/L hard cutoff, below very hard.
At 157 mg/L (9.2 gpg), water-softener owners in Colorado typically set their unit to this hardness — settings calculator.
Questions
Frequently asked questions
- Is Colorado's water hard?
- Colorado's median hardness is 157 mg/L as CaCO₃, "hard" on the USGS scale and 1.12× the national county median of 140 mg/L. About 75% of residents in measured counties have hard-or-worse water.
- Which county in Colorado has the hardest water?
- Prowers County, with a median of 1300 mg/L as CaCO₃ across 881 measurements.
- Is well water harder than city water in Colorado?
- Groundwater measures harder here — about 1.8× the surface water — so wells tend to run harder (groundwater 280 vs surface water 152 mg/L).
- How do I find my exact hardness in Colorado?
- Search your ZIP on the lookup tool, read your utility's Consumer Confidence Report, or test at home with a kit.
- Is Colorado's water harder than the national average?
- Yes. Colorado's median of 157 mg/L is 1.12× the national county median of 140 mg/L, and Colorado ranks #18 of the 50 states and D.C.
Compare
States with similar hardness
Two states measure closest to Colorado's 157 mg/L: Florida at 151 mg/L and California at 150 mg/L. Colorado measures harder than 66% of states. Browse the full ranking on the statistics page.
More: hardness scale · check your address · national statistics · the national map.
By Marko Visic, MPharm, BSc Physics. Source: USGS/EPA Water Quality Portal — 218,893 Colorado measurements. Data last verified . Methodology.
Cite this page: “Colorado Water Hardness by County.” Hard Water Map. Retrieved 2026-07-22, https://hardwatermap.com/water-hardness/colorado/