Ohio Water Hardness by County
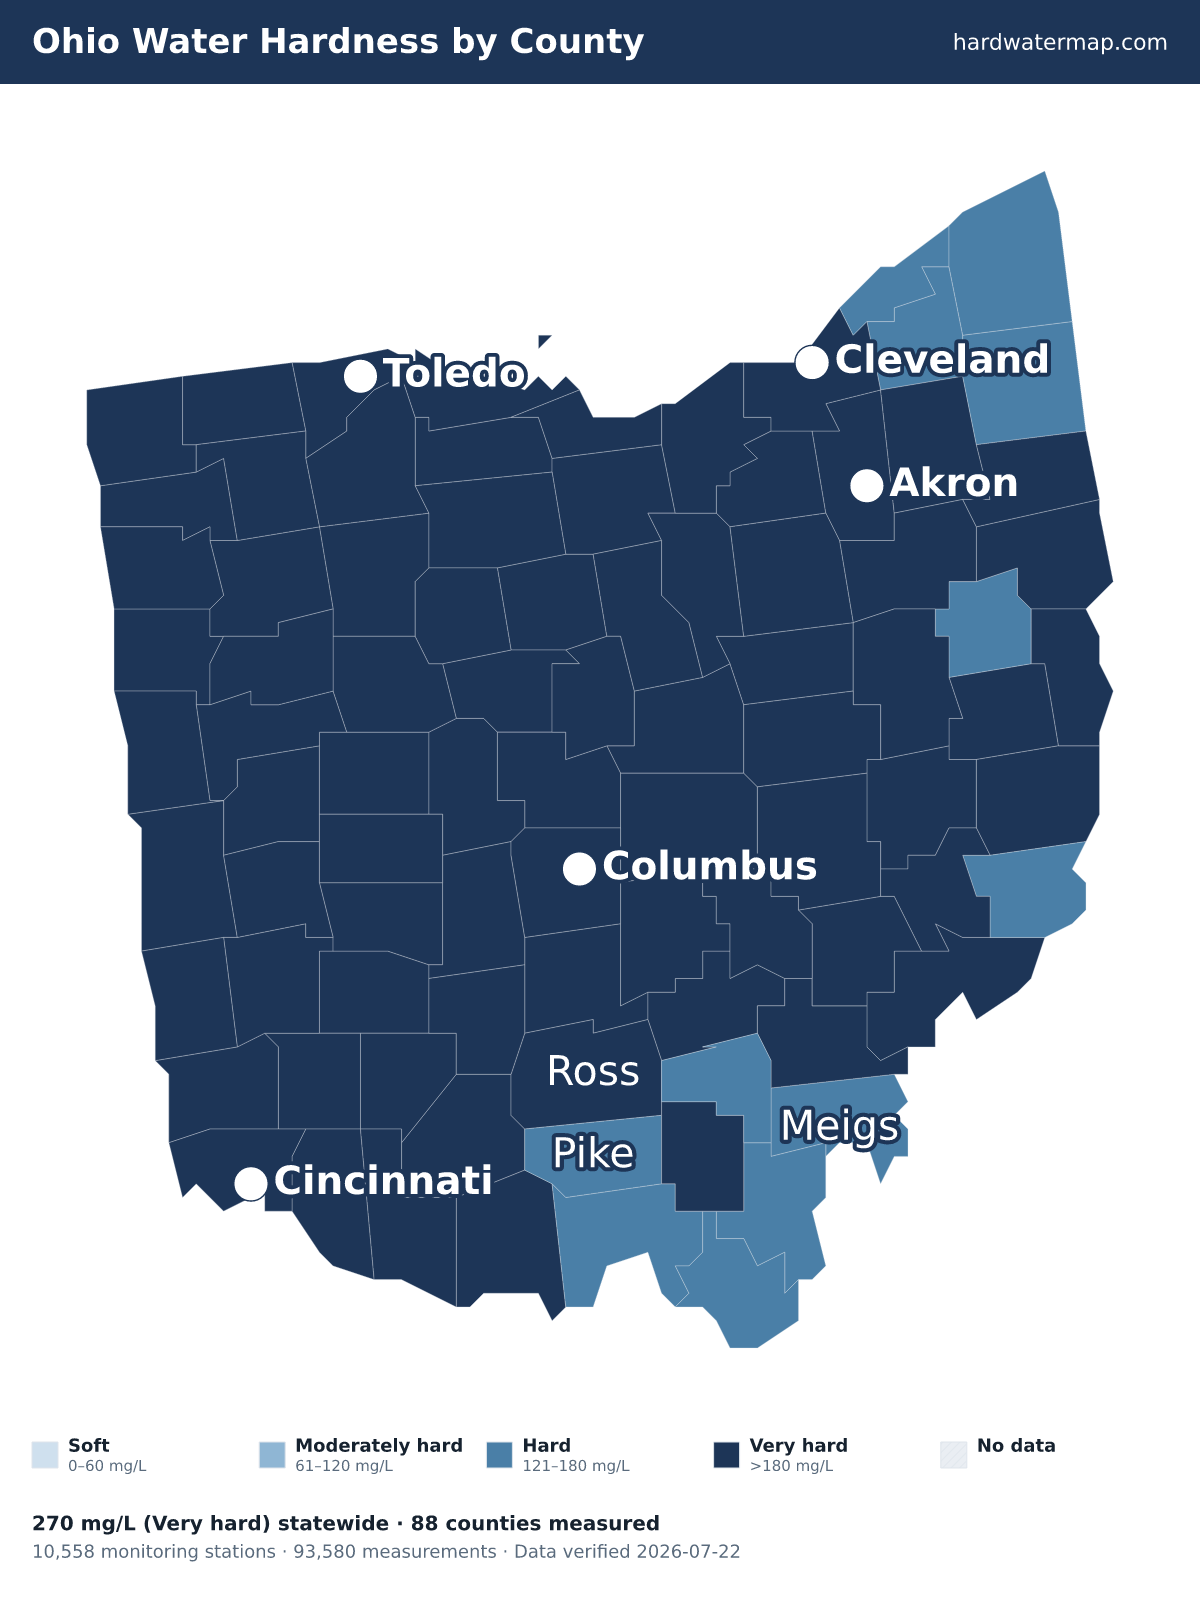
Water in Ohio has a median hardness of 270 mg/L as CaCO₃ — "very hard" on the USGS scale — based on 93,580 measurements at 10,558 monitoring stations. Belmont County has the state's hardest measured water (374 mg/L); Carroll County the softest (120). Rank: #7 of the 50 states and D.C.
Ohio water hardness map — what the numbers mean. Data verified 2026-07-22.
Every one of Ohio's 88 measured counties tests hard or harder: 76 rank very hard and 12 rank hard. The hardest are Belmont County (374 mg/L), Clark County (367.5), and Champaign County (366.5). Even Carroll County, the softest measured area in the state, reads 120 mg/L — still hard on the USGS scale.
About 100% of Ohio's roughly 11.8 million residents in counties with gate-passing hardness data live where tap water is hard or worse.
Statewide, Ohio's median works out to 15.8 grains per gallon and ranks #7 of the 50 states and D.C. Across 93,580 measurements at 10,558 stations — 61,680 of them since 2000 — the middle 80% of readings fall between 131 and 422 mg/L. The public record runs from 1938 to 2024.
See where Ohio sits nationally on the national map, or what its number means on the hardness scale.
Download the Ohio water hardness map (PNG) — Water hardness by county in Ohio: 88 counties mapped from USGS/EPA data, statewide median 270 mg/L (very hard); darker counties have harder water.
By county
Water hardness by county
The table lists all 88 measured Ohio counties, hardest first. Their medians span 374 mg/L in Belmont County to 120 in Carroll County — a 3.1× range.
| County | Median | Band | Results | Sites | Newest |
|---|---|---|---|---|---|
| Belmont County | 374 | Very hard | 1,213 | 206 | 2024 |
| Clark County | 367.5 | Very hard | 1,008 | 130 | 2024 |
| Champaign County | 366.5 | Very hard | 740 | 108 | 2020 |
| Hardin County | 364 | Very hard | 496 | 67 | 2024 |
| Logan County | 361 | Very hard | 669 | 104 | 2024 |
| Greene County | 360 | Very hard | 1,444 | 169 | 2024 |
| Wyandot County | 356 | Very hard | 937 | 73 | 2024 |
| Mercer County | 355 | Very hard | 773 | 89 | 2024 |
| Darke County | 354 | Very hard | 1,372 | 171 | 2020 |
| Madison County | 351 | Very hard | 868 | 109 | 2024 |
| Shelby County | 351 | Very hard | 531 | 91 | 2022 |
| Harrison County | 350 | Very hard | 798 | 127 | 2024 |
| Union County | 331 | Very hard | 1,315 | 140 | 2024 |
| Auglaize County | 330 | Very hard | 859 | 106 | 2024 |
| Huron County | 330 | Very hard | 783 | 94 | 2024 |
| Miami County | 330 | Very hard | 1,189 | 155 | 2024 |
| Montgomery County | 328 | Very hard | 2,897 | 303 | 2024 |
| Preble County | 328 | Very hard | 759 | 131 | 2024 |
| Butler County | 326 | Very hard | 2,195 | 216 | 2021 |
| Tuscarawas County | 322 | Very hard | 1,959 | 289 | 2024 |
| Fayette County | 320 | Very hard | 633 | 73 | 2024 |
| Marion County | 313 | Very hard | 947 | 84 | 2024 |
| Seneca County | 313 | Very hard | 574 | 53 | 2024 |
| Hancock County | 312 | Very hard | 956 | 97 | 2024 |
| Sandusky County | 310 | Very hard | 1,144 | 110 | 2024 |
| Allen County | 308 | Very hard | 1,490 | 150 | 2024 |
| Fairfield County | 308 | Very hard | 1,347 | 129 | 2022 |
| Perry County | 304 | Very hard | 591 | 172 | 2022 |
| Putnam County | 304 | Very hard | 1,307 | 80 | 2024 |
| Pickaway County | 302.5 | Very hard | 1,808 | 124 | 2024 |
| Crawford County | 302 | Very hard | 506 | 63 | 2024 |
| Hamilton County | 301 | Very hard | 1,966 | 146 | 2024 |
| Stark County | 298 | Very hard | 1,950 | 188 | 2024 |
| Fulton County | 296 | Very hard | 409 | 44 | 2024 |
| Warren County | 295 | Very hard | 692 | 93 | 2024 |
| Henry County | 293.5 | Very hard | 366 | 42 | 2024 |
| Noble County | 293 | Very hard | 412 | 85 | 2016 |
| Williams County | 291.5 | Very hard | 546 | 115 | 2024 |
| Morrow County | 290 | Very hard | 802 | 60 | 2024 |
| Ottawa County | 288 | Very hard | 560 | 53 | 2024 |
| Van Wert County | 287 | Very hard | 351 | 47 | 2024 |
| Highland County | 282.5 | Very hard | 360 | 59 | 2024 |
| Ross County | 281 | Very hard | 1,582 | 97 | 2024 |
| Wood County | 280 | Very hard | 1,143 | 175 | 2024 |
| Franklin County | 277 | Very hard | 3,328 | 370 | 2024 |
| Morgan County | 275 | Very hard | 833 | 107 | 2024 |
| Clinton County | 274 | Very hard | 325 | 67 | 2018 |
| Delaware County | 272 | Very hard | 1,749 | 110 | 2024 |
| Columbiana County | 271 | Very hard | 1,195 | 146 | 2024 |
| Defiance County | 270 | Very hard | 1,149 | 59 | 2024 |
| Licking County | 270 | Very hard | 914 | 90 | 2024 |
| Richland County | 269 | Very hard | 436 | 62 | 2024 |
| Paulding County | 267.5 | Very hard | 490 | 51 | 2024 |
| Erie County | 267 | Very hard | 907 | 73 | 2024 |
| Jefferson County | 260 | Very hard | 1,419 | 193 | 2024 |
| Wayne County | 257 | Very hard | 799 | 127 | 2024 |
| Muskingum County | 249.5 | Very hard | 1,001 | 163 | 2024 |
| Medina County | 246 | Very hard | 503 | 72 | 2018 |
| Ashland County | 240 | Very hard | 509 | 52 | 2024 |
| Athens County | 238 | Very hard | 1,673 | 197 | 2024 |
| Lucas County | 236 | Very hard | 2,676 | 166 | 2024 |
| Lorain County | 230 | Very hard | 1,855 | 140 | 2024 |
| Holmes County | 225 | Very hard | 606 | 83 | 2024 |
| Summit County | 221.5 | Very hard | 2,077 | 202 | 2024 |
| Hocking County | 221 | Very hard | 810 | 118 | 2024 |
| Knox County | 221 | Very hard | 874 | 54 | 2024 |
| Cuyahoga County | 216 | Very hard | 3,147 | 202 | 2024 |
| Guernsey County | 214 | Very hard | 962 | 143 | 2024 |
| Clermont County | 211.5 | Very hard | 1,216 | 127 | 2024 |
| Adams County | 210 | Very hard | 228 | 57 | 2019 |
| Coshocton County | 198 | Very hard | 1,365 | 196 | 2024 |
| Jackson County | 196 | Very hard | 326 | 61 | 2024 |
| Mahoning County | 192 | Very hard | 1,526 | 121 | 2024 |
| Brown County | 190 | Very hard | 425 | 74 | 2024 |
| Washington County | 189.5 | Very hard | 1,076 | 176 | 2024 |
| Portage County | 180 | Very hard | 952 | 153 | 2024 |
| Pike County | 179 | Hard | 458 | 113 | 2024 |
| Lake County | 178 | Hard | 1,228 | 72 | 2024 |
| Geauga County | 168 | Hard | 804 | 165 | 2024 |
| Gallia County | 160 | Hard | 965 | 108 | 2024 |
| Monroe County | 151 | Hard | 444 | 78 | 2018 |
| Meigs County | 150 | Hard | 306 | 64 | 2019 |
| Scioto County | 150 | Hard | 1,275 | 93 | 2022 |
| Trumbull County | 150 | Hard | 1,469 | 134 | 2024 |
| Vinton County | 150 | Hard | 1,314 | 126 | 2024 |
| Lawrence County | 142 | Hard | 569 | 116 | 2019 |
| Ashtabula County | 132 | Hard | 1,569 | 167 | 2024 |
| Carroll County | 120 | Hard | 581 | 93 | 2022 |
ZIP codes
ZIP codes in Ohio
The ZIP codes below are grouped by the Ohio county each mostly falls within (by land area). Each ZIP takes that county's measured median — shown in the group header — so this is a ZIP-to-county guide, not a separate reading for every ZIP. To check the water system serving a specific address, use the lookup.
Key: a † after a ZIP means it has no mapped community water system — usually a private-well area. Plain ZIPs are served by a mapped community water system.
Belmont County · 374 mg/L · Very hard
4371343718†43719†4375943902†43905†43906†43909†43912†43928†43933†4393443935†43940†43942†43947†43950†43951†43967†43972†43977†43983†43985
Clark County · 367.5 mg/L · Very hard
4301045316†45319†4532345341†45344†4534945368†45369†45372†45501455024550345504†45505†45506†
Champaign County · 366.5 mg/L · Very hard
43009†43044†43047†43060†43070†43072†43078†43084†45317†45389
Hardin County · 364 mg/L · Very hard
43310†4332643340†43346†45810†45812†45835†4583645843†45859
Logan County · 361 mg/L · Very hard
433114331843319†43324†43331†43333†43336†43343†43345†43347†4334843357†43360†
Greene County · 360 mg/L · Very hard
45301453054530745314†4532445335†4537045384†453854538745430454314543245433454344543545440
Wyandot County · 356 mg/L · Very hard
4331643323†43330†43351†43359†44849†44882†
Mercer County · 355 mg/L · Very hard
45310†45822†4582645828†45846†45860†4586245866†45882†45883†
Darke County · 354 mg/L · Very hard
45303†45304†45308†4532845331†45332†45346†45348†45350†45351†45352†45358†45362†45380†45388†45390†
Madison County · 351 mg/L · Very hard
43029†43064†43140†43143†4315143153†43162†
Shelby County · 351 mg/L · Very hard
45302†45306†45333†4533445336†45340†45353†45360†45363†4536545845†
Harrison County · 350 mg/L · Very hard
4390743973†4397443976†4398143986†43988†44693†44699†
Union County · 331 mg/L · Very hard
43007†43036†4304043045†43067†43077†43344†43358†
Auglaize County · 330 mg/L · Very hard
45819†4586545869†45870†45871†45884†45885†45888†45895†45896†
Huron County · 330 mg/L · Very hard
44811†44826†44837†44847†44850†44851†44855†44857†44865†44889†44890†
Miami County · 330 mg/L · Very hard
45312†4531845326†45337†45339†453564535945361†453714537345383†
Montgomery County · 328 mg/L · Very hard
453094531545322†45325†45327†453424534545354†45377†454024540345404454054540645409454104541445415454164541745419†45420†454234542445426454284542945439†45449454584545945469
Preble County · 328 mg/L · Very hard
45003†450704531145320†45321†453304533845347†453784538145382†
Butler County · 326 mg/L · Very hard
45011†4501345014450154504245044450504505345055†450564506245064†45067†45069
Tuscarawas County · 322 mg/L · Very hard
43832†43837†43840†44612†44621†4462244629†4465344656†4466344671†44678†44680†446814468244683†44697†
Fayette County · 320 mg/L · Very hard
43106†43128†43142†43160
Marion County · 313 mg/L · Very hard
433024331443322†43332†43337†43341†43342†43356
Seneca County · 313 mg/L · Very hard
44802†44807†44809†4481544818†44828†4483044836†44841†44844†44853†44861†44867†44883
Hancock County · 312 mg/L · Very hard
44804†45814†45816†4584045841†4585845867†45868†45881†45889†45890†45897†
Sandusky County · 310 mg/L · Very hard
43407†43410†4342043431†43435†4344243464†43469†
Allen County · 308 mg/L · Very hard
45801†45804†4580545806†45807†4580845809†45817†45820†458334585045854†45887†
Fairfield County · 308 mg/L · Very hard
4304643102†43105†43107†43110†4311243130431364314743148†43150†43154†43155†43157
Perry County · 304 mg/L · Very hard
43076†43730†43731†43739†43748†43760†43761†43764†43766†43782†43783†
Putnam County · 304 mg/L · Very hard
45815†45827†45830†45831†45844†458484585345856†45864†45875†4587645877†45893†
Pickaway County · 302.5 mg/L · Very hard
43103†43113†431164311743137†43145†43146†43156†43164
Crawford County · 302 mg/L · Very hard
4482044825†44827†44854†44856†44881†44887†
Hamilton County · 301 mg/L · Very hard
45001†450024503045033450414505145052451114517445202452034520445205452064520745208452094521145212452134521445215†4521645217452184521945220452234522445225452264522745229452304523145232452334523645237452384523945240452414524245243452444524645247452484524945251452524525545267
Stark County · 298 mg/L · Very hard
4460144608†446134461444626†4463044632†44640†44641†446464464744652†44662†44666†44669†44670†44688†447024470344704447054470644707†447084470944710447144471844720†44721†44730†
Fulton County · 296 mg/L · Very hard
43502†43515†43521†4353343540†4355343558†43567†
Warren County · 295 mg/L · Very hard
45005†45032†4503445036450394504045054†450654506645068†45152†45162
Henry County · 293.5 mg/L · Very hard
43510†43516†43523†4352443527†43532†43534†43535†4354543548†43555
Noble County · 293 mg/L · Very hard
43711†4371743724†43772†43779†43788†45727†45745†
Williams County · 291.5 mg/L · Very hard
43501†43505†4350643517†43518†43531†43543†43554†43557†43570
Morrow County · 290 mg/L · Very hard
4300343315433174332043321433254333443338†4335044833
Ottawa County · 288 mg/L · Very hard
43408†43416†43430†43432†43433†43436†4343943440†43445†43446†43449†43452†43456†43458†43468†
Van Wert County · 287 mg/L · Very hard
45832†45838†45863†45874†4589145894†45898†45899†
Highland County · 282.5 mg/L · Very hard
4512345132†45133†45135†45142†4515545172†
Ross County · 281 mg/L · Very hard
4310143115†45601†45612†4561745628456444567345681†
Wood County · 280 mg/L · Very hard
43402†4340343406†43413†43414†43437†434434344743450†43451†43457†43460†43462†434634346543466†43467†43511†43522†43525†43529†43541†4355143565435694361944817†45872
Franklin County · 277 mg/L · Very hard
4300243004430164301743026430544306843081430854310943119†4312343125431264320143202432034320443205432064320743209432104321143212432134321443215432174321843219432204322143222432234322443227432284322943230432314323243235
Morgan County · 275 mg/L · Very hard
4372843756†43758†43787†45715†
Clinton County · 274 mg/L · Very hard
451074511345146†45148†45159†45164†45166†45169†45177†
Delaware County · 272 mg/L · Very hard
430154302143032†43035430614306543066430744308243240
Columbiana County · 271 mg/L · Very hard
43920†43945†43962†43968†444084441344415†44423†44431†44432†44441†4444544455†444604449044493†44625†44634†44665†
Defiance County · 270 mg/L · Very hard
4351243519†43520†43526†43530†43536†43549†43556†
Licking County · 270 mg/L · Very hard
430014300843013†43018†4302343025†43027†43030†43031†4303343055†43056†4306243071†43080†43721†43740
Richland County · 269 mg/L · Very hard
44813†44822†44843†4487544878†44901449024490344904†44905†4490644907
Paulding County · 267.5 mg/L · Very hard
45813†45821†45849†45851†45855†45861†45873†45879†45880†45886†
Erie County · 267 mg/L · Very hard
43438†4408944814†44824448394484644870
Jefferson County · 260 mg/L · Very hard
43901†43908†43910†43913†43917†43925†43926†43930†43932†43938†43939†43943†43944439484395243953†43961439634396443971
Wayne County · 257 mg/L · Very hard
44214†44217†442304427044276†44287†44606†44618†44645†446594466744676†44677†44691†
Muskingum County · 249.5 mg/L · Very hard
4370143720†43727†4373443735†4373843746†43762†43767†43771†43777†4379143802†43821†43822†43830†43842
Medina County · 246 mg/L · Very hard
44212442154423344235442514425344254†4425644273†44274†442754428044281
Ashland County · 240 mg/L · Very hard
448054483844840†44842†4485944864†44866†4487444880
Athens County · 238 mg/L · Very hard
45701†45711†45716†4571945723†45732†45735†45739†45740†4576145766†45778†4578045782
Lucas County · 236 mg/L · Very hard
43412†4343443504†435284353743542†43547†43560†43566†43571436044360543606436074360843609436104361143612†4361343614436154361643617†4362043623
Lorain County · 230 mg/L · Very hard
44001†440114401244028440354403944044440494405044052†44053†44054440554407444090
Holmes County · 225 mg/L · Very hard
43804†4461044611†44624†44627†44628†44633†44637†44638†44654†44660†44661†4468744689†44690
Summit County · 221.5 mg/L · Very hard
4405644067440874420344216†4422144223442244423244236442504426244264†44278442864430144302443034430444305443064430744308443104431144312†443134431444319†4432044321†4432544333†44685†
Hocking County · 221 mg/L · Very hard
4311143127†43135†43138†43144†43149†43152†43158†45764†
Knox County · 221 mg/L · Very hard
43005†4301143014†43019†43022†43028†43037†43050†
Cuyahoga County · 216 mg/L · Very hard
4401744022†4404044070441014410244103441044410544106441074410844109441104411144112441134411444115441164411744118441194412044121441224412344124441254412644127441284412944130441314413244133441344413544136441374413844139441404414144142441434414444145441464414744149
Guernsey County · 214 mg/L · Very hard
43722†43723†4372543732†43733†43736†43749†43750†43755†43768†43773†43778†43780†
Clermont County · 211.5 mg/L · Very hard
451024510345106451124512045122†451404514745150451534515645157451584516045176†45245
Adams County · 210 mg/L · Very hard
4510545144†45616†4561845650†45660†45679†45684†4569345697†
Coshocton County · 198 mg/L · Very hard
43006†43805†43811†43812†43824†4383643843†43844†43845†
Jackson County · 196 mg/L · Very hard
4562145640†4565645685†45692
Mahoning County · 192 mg/L · Very hard
44401†4440544406†44429†4443644442†44443†44449†44451†4445244454†4447144502445034450444505445064450744509445104451144512445144451544555446094461944672
Brown County · 190 mg/L · Very hard
45101†45115†4511845119†4512145130†45131†4515445167†45168†45171†
Washington County · 189.5 mg/L · Very hard
45714†45721†4572445729†4574245744†45746†4575045767†45768†45773†4578445786†45788†45789†
Portage County · 180 mg/L · Very hard
44201†4420244231†44234†44240†44241442434425544260†44266†44272†44285†44288†44411†44412†
Pike County · 179 mg/L · Hard
4561345624†45642†45646†45661†45690†
Lake County · 178 mg/L · Hard
44045†44057†4406044077†44081440924409444095
Geauga County · 168 mg/L · Hard
44021†44023†4402444026†44046†44062†44064†44065†44072†44080†44086†
Gallia County · 160 mg/L · Hard
45614†45620†45623†4563145658†4567445686†
Monroe County · 151 mg/L · Hard
43716†43747†43754†43786†43793†43914†43915†4393143946†45734†
Meigs County · 150 mg/L · Hard
45710†45720†4574145743†4576045769†45770†45771†45772†4577545776†4577945783
Scioto County · 150 mg/L · Hard
45629†4563045636†45648†45652†45653†45657†45662†45663†45671†45677†45682†45694†45699†
Trumbull County · 150 mg/L · Hard
44402†4440344404†44410†44417†44418†44420†44424†4442544428†44430†4443744438†44439†44440†444444444644450†44470†444734448144483†44484†4448544491†
Vinton County · 150 mg/L · Hard
45622†45634†4564745651†45654†45672†45695†45698†
Lawrence County · 142 mg/L · Hard
4561945638456454565945669†45678†4568045688†45696†
Ashtabula County · 132 mg/L · Hard
44003†4400444010†44030†44032†44041†44047†44048†44068†44076†44082†44084†44085†44093†44099†
Carroll County · 120 mg/L · Hard
43903†44427†44607†44615†44620†44639†44643†4464444651†4465744675†44695†
† 690 ZIP codes are not served by a mapped community water system — most are private-well areas. See well water hardness.
Source
Groundwater vs surface water
Ohio's groundwater measures harder than its surface water — 360 mg/L across 4,174 samples versus 263 across 82,470, about 1.4× harder. Wells draw from groundwater, so well owners in Ohio tend to see the harder number — 360 mg/L, very hard. Groundwater readings there run 157.4 to 639 mg/L across the middle 80% of samples. The comparison draws on 1,764 groundwater and 7,964 surface-water monitoring sites; 313 readings above 2,000 mg/L were logged but held out of the medians as outliers.
Groundwater (wells)
360 mg/L as CaCO₃ · 4,174 results at 1,764 stations.
Surface water (rivers, lakes)
263 mg/L as CaCO₃ · 82,470 results at 7,964 stations.
Groundwater measures about 1.4× harder than surface water here.
Chemistry
Water chemistry in Ohio
Beyond the hardness number, Ohio's water carries a fuller chemical signature — here is how its measured parameters compare to national benchmarks.
TDS
396 mg/L · n=38,425
396 mg/L — about 1.8× the national county median of 226, consistent with hard, mineral-rich water.
pH
7.9 pH · n=24,131
pH 7.9 — within the EPA secondary range of 6.5–8.5, on the alkaline side.
Alkalinity
170 mg/L as CaCO3 · n=58,692
170 mg/L — substantial buffering capacity, which resists pH swings.
Calcium : Magnesium
69 : 21.4 mg/L ≈ 3.22 : 1 · n=62,051
Calcium is about 66% of Ohio's hardness (69 mg/L Ca to 21.4 mg/L Mg), a little more magnesium-rich than the national ~68% calcium share.
Parameter medians may include a small share of quality-control samples; the hardness lane is fully QC-filtered.
Aquifers
Major aquifers under Ohio
3 aquifer systems supply much of Ohio's measured groundwater.
- Silurian-Devonian aquifers — median 451 mg/L across 335 samples at 286 sites: very hard.
- Sand and gravel aquifers (glaciated regions) — median 375 mg/L across 1,673 samples at 708 sites: very hard.
- Alluvial aquifers — median 264.5 mg/L across 60 samples at 35 sites: very hard.
Together these systems account for 2,068 measured samples at 1,029 sites. Aquifer medians pool samples across a whole system and can mask local variation — see the national aquifer map for how these compare across states.
Trend
Hardness over time
Ohio's decade median moved from 270 mg/L in the 1950s to 258 in the 2020s. Over the series, the decade median peaked at 318 mg/L in the 1990s and bottomed at 240 in the 2010s. Decade medians reflect where and what agencies sampled in each era, not just changes in the water itself.
Scale
Where Ohio sits on the scale
On the USGS scale, Ohio's 270 mg/L is very hard — 15.8 grains per gallon, well above the 180 mg/L very-hard cutoff — among the hardest water measured in the US.
At 270 mg/L (15.8 gpg), water-softener owners in Ohio typically set their unit to this hardness — settings calculator.
Questions
Frequently asked questions
- Is Ohio's water hard?
- Ohio's median hardness is 270 mg/L as CaCO₃, "very hard" on the USGS scale and 1.93× the national county median of 140 mg/L. About 100% of residents in measured counties have hard-or-worse water.
- Which county in Ohio has the hardest water?
- Belmont County, with a median of 374 mg/L as CaCO₃ across 1,213 measurements. Even the softest, Carroll County at 120 mg/L, is still "hard" on the USGS scale.
- Is well water harder than city water in Ohio?
- Groundwater measures harder here — about 1.4× the surface water — so wells tend to run harder (groundwater 360 vs surface water 263 mg/L).
- How do I find my exact hardness in Ohio?
- Search your ZIP on the lookup tool, read your utility's Consumer Confidence Report, or test at home with a kit.
- Is Ohio's water harder than the national average?
- Yes. Ohio's median of 270 mg/L is 1.93× the national county median of 140 mg/L, and Ohio ranks #7 of the 50 states and D.C.
Compare
States with similar hardness
Two states measure closest to Ohio's 270 mg/L: Utah at 270 mg/L and Indiana at 280 mg/L. Ohio measures harder than 88% of states. Browse the full ranking on the statistics page.
More: hardness scale · check your address · national statistics · the national map.
By Marko Visic, MPharm, BSc Physics. Source: USGS/EPA Water Quality Portal — 93,580 Ohio measurements. Data last verified . Methodology.
Cite this page: “Ohio Water Hardness by County.” Hard Water Map. Retrieved 2026-07-22, https://hardwatermap.com/water-hardness/ohio/