Kansas Water Hardness by County
Water in Kansas has a median hardness of 260 mg/L as CaCO₃ — "very hard" on the USGS scale — based on 103,475 measurements at 11,195 monitoring stations. Hamilton County has the state's hardest measured water (1500 mg/L); Scott County the softest (1.2). Rank: #9 of the 50 states and D.C.
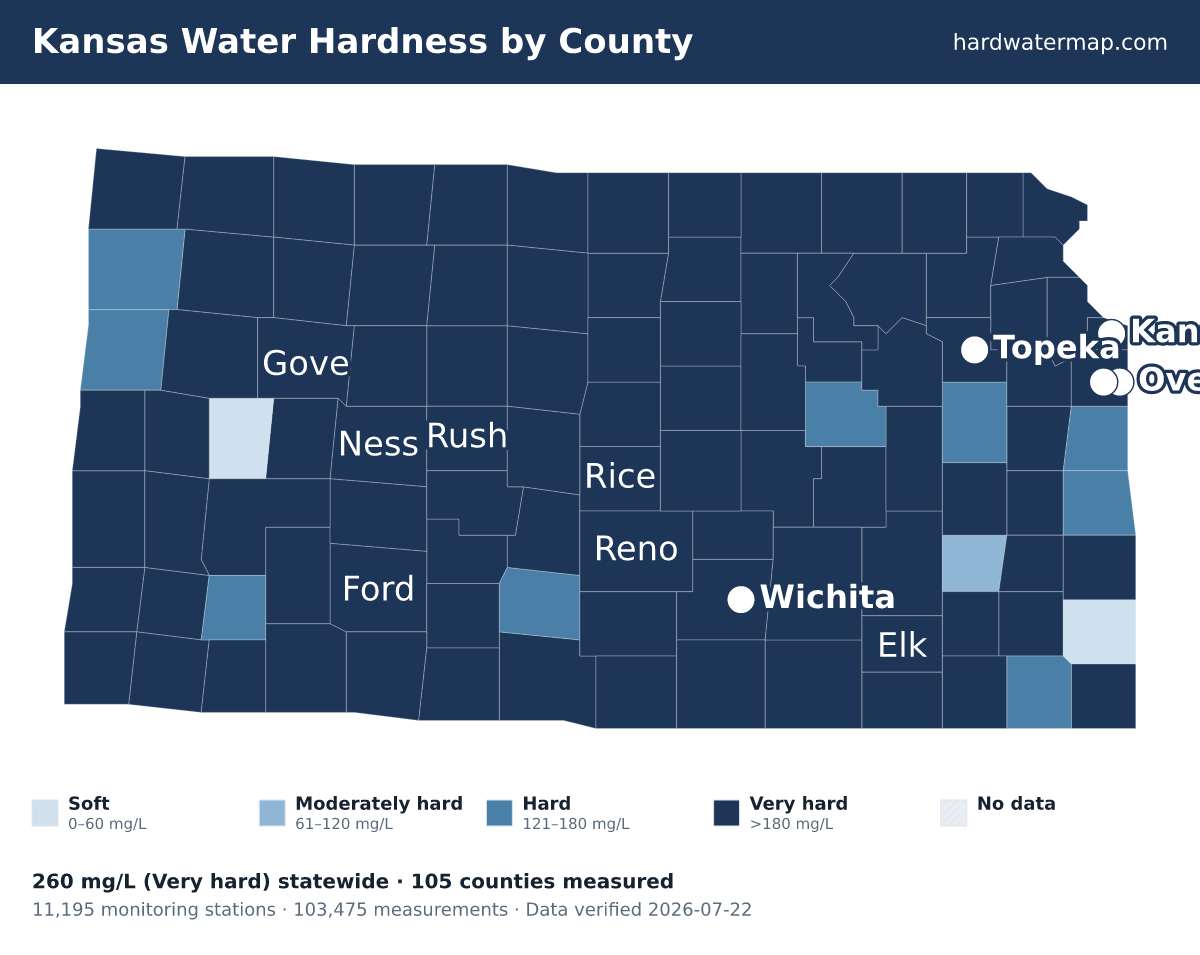
Kansas water hardness map — what the numbers mean. Data verified 2026-07-22.
Of Kansas's 105 measured counties, 93 very hard, 9 hard, 1 moderately hard, and 2 soft. The hardest are Hamilton County (1500 mg/L), Gove County (550), and Russell County (540). Scott County is the softest at 1.2 mg/L (soft).
About 98% of Kansas's roughly 2.9 million residents in counties with gate-passing hardness data live where tap water is hard or worse.
Statewide, Kansas's median works out to 15.2 grains per gallon and ranks #9 of the 50 states and D.C. Across 103,475 measurements at 11,195 stations — 28,016 of them since 2000 — the middle 80% of readings fall between 130 and 540 mg/L. The public record runs from 1913 to 2023.
See where Kansas sits nationally on the national map, or what its number means on the hardness scale.
Download the Kansas water hardness map (PNG) — Water hardness by county in Kansas: 105 counties mapped from USGS/EPA data, statewide median 260 mg/L (very hard); darker counties have harder water.
By county
Water hardness by county
The table lists all 105 measured Kansas counties, hardest first. Their medians span 1500 mg/L in Hamilton County to 1.2 in Scott County — a 1250× range.
| County | Median | Band | Results | Sites | Newest |
|---|---|---|---|---|---|
| Hamilton County | 1500 | Very hard | 874 | 95 | 2023 |
| Gove County | 550 | Very hard | 214 | 91 | 2016 |
| Russell County | 540 | Very hard | 2,390 | 112 | 2016 |
| Lincoln County | 520 | Very hard | 657 | 64 | 2016 |
| Edwards County | 510 | Very hard | 269 | 63 | 2016 |
| Clark County | 500 | Very hard | 198 | 63 | 2015 |
| Ford County | 485 | Very hard | 646 | 165 | 2016 |
| Kearny County | 468 | Very hard | 291 | 99 | 2016 |
| Barber County | 440 | Very hard | 1,026 | 108 | 2016 |
| Ellis County | 440 | Very hard | 1,733 | 201 | 2018 |
| Finney County | 440 | Very hard | 297 | 108 | 2021 |
| Rooks County | 440 | Very hard | 773 | 69 | 2018 |
| Osborne County | 430 | Very hard | 1,416 | 60 | 2018 |
| Dickinson County | 420 | Very hard | 1,582 | 75 | 2018 |
| Ness County | 420 | Very hard | 302 | 72 | 2018 |
| Smith County | 420 | Very hard | 192 | 27 | 2016 |
| Logan County | 415 | Very hard | 279 | 78 | 2016 |
| Comanche County | 410 | Very hard | 787 | 42 | 2016 |
| Trego County | 400 | Very hard | 1,049 | 125 | 2018 |
| Meade County | 390 | Very hard | 696 | 109 | 2016 |
| Rice County | 390 | Very hard | 1,120 | 188 | 2016 |
| Barton County | 380 | Very hard | 1,137 | 127 | 2016 |
| Ellsworth County | 370 | Very hard | 1,145 | 72 | 2016 |
| Marion County | 370 | Very hard | 872 | 89 | 2017 |
| Phillips County | 370 | Very hard | 836 | 98 | 2018 |
| Butler County | 360 | Very hard | 3,130 | 684 | 2017 |
| Rush County | 360 | Very hard | 339 | 88 | 2016 |
| Saline County | 350 | Very hard | 1,610 | 82 | 2016 |
| Jewell County | 340 | Very hard | 434 | 80 | 2016 |
| Mitchell County | 340 | Very hard | 864 | 86 | 2016 |
| Ottawa County | 340 | Very hard | 1,815 | 149 | 2016 |
| Cloud County | 330 | Very hard | 1,181 | 103 | 2016 |
| McPherson County | 330 | Very hard | 369 | 161 | 2017 |
| Graham County | 320 | Very hard | 100 | 38 | 2016 |
| Jackson County | 320 | Very hard | 751 | 102 | 2017 |
| Chase County | 310 | Very hard | 1,430 | 69 | 2018 |
| Clay County | 310 | Very hard | 771 | 57 | 2016 |
| Cowley County | 300 | Very hard | 3,406 | 172 | 2017 |
| Nemaha County | 290 | Very hard | 1,319 | 130 | 2016 |
| Republic County | 290 | Very hard | 812 | 116 | 2018 |
| Wabaunsee County | 290 | Very hard | 1,044 | 65 | 2017 |
| Decatur County | 280 | Very hard | 349 | 67 | 2011 |
| Morton County | 280 | Very hard | 137 | 66 | 2014 |
| Reno County | 278 | Very hard | 3,150 | 327 | 2023 |
| Riley County | 272 | Very hard | 1,774 | 117 | 2016 |
| Hodgeman County | 270 | Very hard | 202 | 110 | 2016 |
| Norton County | 270 | Very hard | 562 | 87 | 2016 |
| Pottawatomie County | 270 | Very hard | 1,237 | 104 | 2023 |
| Geary County | 260 | Very hard | 1,434 | 61 | 2018 |
| Lane County | 260 | Very hard | 92 | 64 | 2015 |
| Lyon County | 260 | Very hard | 1,439 | 82 | 2016 |
| Brown County | 250 | Very hard | 993 | 104 | 2017 |
| Marshall County | 250 | Very hard | 1,606 | 83 | 2016 |
| Sedgwick County | 250 | Very hard | 5,831 | 493 | 2023 |
| Seward County | 250 | Very hard | 136 | 80 | 2015 |
| Shawnee County | 250 | Very hard | 2,883 | 164 | 2023 |
| Stevens County | 250 | Very hard | 131 | 73 | 2015 |
| Sumner County | 250 | Very hard | 1,897 | 180 | 2018 |
| Wyandotte County | 250 | Very hard | 963 | 143 | 2018 |
| Grant County | 240 | Very hard | 220 | 176 | 2010 |
| Harper County | 240 | Very hard | 446 | 55 | 2016 |
| Johnson County | 240 | Very hard | 2,571 | 175 | 2019 |
| Kiowa County | 240 | Very hard | 384 | 78 | 2021 |
| Rawlins County | 240 | Very hard | 119 | 60 | 2014 |
| Doniphan County | 230 | Very hard | 557 | 74 | 2016 |
| Greenwood County | 230 | Very hard | 1,525 | 52 | 2016 |
| Harvey County | 230 | Very hard | 5,246 | 433 | 2023 |
| Leavenworth County | 230 | Very hard | 868 | 128 | 2023 |
| Pawnee County | 230 | Very hard | 460 | 99 | 2016 |
| Stafford County | 230 | Very hard | 334 | 108 | 2017 |
| Atchison County | 221 | Very hard | 845 | 83 | 2017 |
| Douglas County | 220 | Very hard | 1,787 | 177 | 2017 |
| Jefferson County | 220 | Very hard | 1,096 | 94 | 2016 |
| Kingman County | 220 | Very hard | 1,003 | 84 | 2017 |
| Stanton County | 220 | Very hard | 206 | 140 | 2000 |
| Bourbon County | 210 | Very hard | 1,206 | 37 | 2017 |
| Coffey County | 210 | Very hard | 862 | 45 | 2017 |
| Wichita County | 210 | Very hard | 131 | 89 | 2021 |
| Chautauqua County | 200 | Very hard | 733 | 50 | 2017 |
| Cheyenne County | 200 | Very hard | 414 | 74 | 2016 |
| Gray County | 200 | Very hard | 162 | 107 | 2021 |
| Sheridan County | 200 | Very hard | 164 | 85 | 2014 |
| Washington County | 200 | Very hard | 811 | 62 | 2017 |
| Cherokee County | 190 | Very hard | 2,528 | 262 | 2016 |
| Greeley County | 190 | Very hard | 87 | 60 | 2015 |
| Thomas County | 190 | Very hard | 129 | 85 | 2015 |
| Allen County | 180 | Very hard | 175 | 64 | 2016 |
| Anderson County | 180 | Very hard | 184 | 36 | 2017 |
| Elk County | 180 | Very hard | 176 | 43 | 2017 |
| Franklin County | 180 | Very hard | 964 | 33 | 2017 |
| Montgomery County | 180 | Very hard | 1,898 | 84 | 2016 |
| Neosho County | 180 | Very hard | 664 | 66 | 2016 |
| Wilson County | 180 | Very hard | 951 | 41 | 2016 |
| Haskell County | 170 | Hard | 94 | 60 | 2010 |
| Labette County | 170 | Hard | 1,151 | 71 | 2016 |
| Linn County | 170 | Hard | 886 | 81 | 2017 |
| Morris County | 170 | Hard | 557 | 27 | 2017 |
| Osage County | 170 | Hard | 1,200 | 62 | 2017 |
| Pratt County | 170 | Hard | 475 | 134 | 2015 |
| Wallace County | 170 | Hard | 209 | 81 | 2021 |
| Miami County | 150 | Hard | 722 | 48 | 2017 |
| Sherman County | 150 | Hard | 147 | 91 | 2005 |
| Woodson County | 87 | Moderately hard | 188 | 23 | 2016 |
| Crawford County | 1.8 | Soft | 1,771 | 113 | 2016 |
| Scott County | 1.2 | Soft | 1,197 | 78 | 2021 |
ZIP codes
ZIP codes in Kansas
The ZIP codes below are grouped by the Kansas county each mostly falls within (by land area). Each ZIP takes that county's measured median — shown in the group header — so this is a ZIP-to-county guide, not a separate reading for every ZIP. To check the water system serving a specific address, use the lookup.
Key: a † after a ZIP means it has no mapped community water system — usually a private-well area. Plain ZIPs are served by a mapped community water system.
Hamilton County · 1500 mg/L · Very hard
67836†67857†67878†
Gove County · 550 mg/L · Very hard
67736†67737†67738†67751†67752†
Russell County · 540 mg/L · Very hard
6762667634676486764967658†67665
Lincoln County · 520 mg/L · Very hard
67418674236745567481
Edwards County · 510 mg/L · Very hard
67519†67547†67552†67563†
Clark County · 500 mg/L · Very hard
67831†67840†67865†
Ford County · 485 mg/L · Very hard
67801†67834†67842†67843†67876†67882†
Kearny County · 468 mg/L · Very hard
67838†67860†
Barber County · 440 mg/L · Very hard
67057670616707067071†67104†67138†67143†
Ellis County · 440 mg/L · Very hard
67601676276763767640†67660†6766767671†67674
Finney County · 440 mg/L · Very hard
67846†67851†67868†
Rooks County · 440 mg/L · Very hard
6763267657†6766367669†67675
Osborne County · 430 mg/L · Very hard
6743767473†6748567623†6765167673
Dickinson County · 420 mg/L · Very hard
6741067431†67441†674516748267492†
Ness County · 420 mg/L · Very hard
67515†67516†67518†6752167560†67572†67584†
Smith County · 420 mg/L · Very hard
6693266951669526696767474†6762867638†
Logan County · 415 mg/L · Very hard
67747†67748†67764†
Comanche County · 410 mg/L · Very hard
67029†6712767155†
Trego County · 400 mg/L · Very hard
67631†67656†67672†
Meade County · 390 mg/L · Very hard
67844†67864†67869†
Rice County · 390 mg/L · Very hard
67427†6745767512†67524†6755467573†67579†
Barton County · 380 mg/L · Very hard
67525†67526†67530†67544†67564
Ellsworth County · 370 mg/L · Very hard
674396744467450674546745967490
Marion County · 370 mg/L · Very hard
66851†66858†66859†6686166866670536706367073†6743867475†67483
Phillips County · 370 mg/L · Very hard
6762167639†67644†67646†67647†6766167664†
Butler County · 360 mg/L · Very hard
66840†668426700267010670126701767039670416704267072†670746712367132671336714467154
Rush County · 360 mg/L · Very hard
67511†67513†67520†67548†675536755667559†67565†67575†
Saline County · 350 mg/L · Very hard
67401†6741667425674426744867470
Jewell County · 340 mg/L · Very hard
6693666941669426694966956669636697067430
Mitchell County · 340 mg/L · Very hard
67420674466745267478
Ottawa County · 340 mg/L · Very hard
6742267436†67467†6748067484†
Cloud County · 330 mg/L · Very hard
66901†66938†6694867417†6744567466†
McPherson County · 330 mg/L · Very hard
6710767428†674436745667460†67464†674766749167546†
Graham County · 320 mg/L · Very hard
67625†67642†67650†67659†
Jackson County · 320 mg/L · Very hard
664166641866419664366644066509665166654066552
Chase County · 310 mg/L · Very hard
66843†66845†66850†66862†66869†
Clay County · 310 mg/L · Very hard
6743267447†6745867468†67487
Cowley County · 300 mg/L · Very hard
67005670086701967023†6703867102671316714667156
Nemaha County · 290 mg/L · Very hard
66404664086641566417664286652266534†6653866550
Republic County · 290 mg/L · Very hard
6693066935669396694066959669606696166964†66966†
Wabaunsee County · 290 mg/L · Very hard
66401†66423†6643166501665076652666834
Decatur County · 280 mg/L · Very hard
67635†67643†67653†67749†
Morton County · 280 mg/L · Very hard
67950†67953†67954†
Reno County · 278 mg/L · Very hard
67501†67502†6750567510†67514†67522†67543†67561†67566†67568†67570†67581†67583†
Riley County · 272 mg/L · Very hard
66442†66449†6650266503665066651766531†66554†
Hodgeman County · 270 mg/L · Very hard
67849†67854†
Norton County · 270 mg/L · Very hard
67622†67629†67645†67654†
Pottawatomie County · 270 mg/L · Very hard
664076642266432665206652166535665366654766549†
Geary County · 260 mg/L · Very hard
6644166514
Lane County · 260 mg/L · Very hard
67839†67850†
Lyon County · 260 mg/L · Very hard
668016683066833668356685466864†6686566868
Brown County · 250 mg/L · Very hard
66094†664246642566434†66439665156652766532
Marshall County · 250 mg/L · Very hard
664036640666411†66412664276643866508†665186654166544†66548†
Sedgwick County · 250 mg/L · Very hard
67001†6701667025†67026†67030†6703767050†670526705567060†6706767101†67108†6714767149†6720267203672046720567206†672076720867209672106721167212672136721467215†67216672176721867219†672206722167223†67226672276722867230†672326723567260
Seward County · 250 mg/L · Very hard
67859†67901†
Shawnee County · 250 mg/L · Very hard
664026640966533665396654266546666036660466605†66606666076660866609†6661066611666126661466615†666166661766618†66619†6662166622
Stevens County · 250 mg/L · Very hard
67951†67952†
Sumner County · 250 mg/L · Very hard
67004†67013†67022†67031†6705167103†67105†67106†67110671196712067140†67152
Wyandotte County · 250 mg/L · Very hard
661016610266103661046610566106661096611166112661156611866160
Grant County · 240 mg/L · Very hard
67880†
Harper County · 240 mg/L · Very hard
6700367009†6701867036†670496705867150†
Johnson County · 240 mg/L · Very hard
6601866021660306603166061660626608566202662036620466205662066620766208662096621066211662126621366214662156621666217662186621966220662216622366224662266622766251
Kiowa County · 240 mg/L · Very hard
67028†67054†67059†67109†
Rawlins County · 240 mg/L · Very hard
67730†67739†67744†67745†
Doniphan County · 230 mg/L · Very hard
66008660176602466035†66087†66090
Greenwood County · 230 mg/L · Very hard
66777†66853†668606686366870†6704567047†67122†67137
Harvey County · 230 mg/L · Very hard
67020†67056†67062671146711767135†67151
Leavenworth County · 230 mg/L · Very hard
6600766012660206602766043660486605266086
Pawnee County · 230 mg/L · Very hard
67523†67529†67550†67567†67574†
Stafford County · 230 mg/L · Very hard
67545†67557†67576†67578†
Atchison County · 221 mg/L · Very hard
66002†66016660236604166058†
Douglas County · 220 mg/L · Very hard
6600666025660446604566046†660476604966050
Jefferson County · 220 mg/L · Very hard
660546606066066660706607366088660976642966512†
Kingman County · 220 mg/L · Very hard
67035†67068†6711167112†67118†67142†67159†
Stanton County · 220 mg/L · Very hard
67855†67862†
Bourbon County · 210 mg/L · Very hard
66701667166673866741667546676966779
Coffey County · 210 mg/L · Very hard
66839†66852668566685766871
Wichita County · 210 mg/L · Very hard
67861†67863†
Chautauqua County · 200 mg/L · Very hard
6702467334673556736067361
Cheyenne County · 200 mg/L · Very hard
67731†67756†
Gray County · 200 mg/L · Very hard
67835†67841†67853†67867†
Sheridan County · 200 mg/L · Very hard
67740†67757†
Washington County · 200 mg/L · Very hard
66933†669376694366944†6694566946†6695366955†66958†6696266968
Cherokee County · 190 mg/L · Very hard
667136672566739667706677366778†667816678267336†
Greeley County · 190 mg/L · Very hard
67879†
Thomas County · 190 mg/L · Very hard
6770167732†67734†67743†67753†
Allen County · 180 mg/L · Very hard
66732†6674266748†66749†66751†6675566772†
Anderson County · 180 mg/L · Very hard
660156603266033660396609166093†
Elk County · 180 mg/L · Very hard
6734567346†673496735267353
Franklin County · 180 mg/L · Very hard
660426606766076†660786607966080†6609266095
Montgomery County · 180 mg/L · Very hard
673016733367335†67337†6734067344†67347†673516736367364
Neosho County · 180 mg/L · Very hard
66720667336674066771†6677566776†
Wilson County · 180 mg/L · Very hard
667106671466717†6673666757†
Haskell County · 170 mg/L · Hard
67837†67870†67877†
Labette County · 170 mg/L · Hard
6733067332673416734267354†67356†67357
Linn County · 170 mg/L · Hard
66010660146604066056660726607566767
Morris County · 170 mg/L · Hard
66838†668466684966872†66873†67449†
Osage County · 170 mg/L · Hard
664136641466451665106652366524†66528†6653766543
Pratt County · 170 mg/L · Hard
67021†67065†67066†67124†67134†
Wallace County · 170 mg/L · Hard
67758†67761†67762†
Miami County · 150 mg/L · Hard
660136602666053660646607166083
Sherman County · 150 mg/L · Hard
67733†67735†67741†
Woodson County · 87 mg/L · Moderately hard
667586676166783
Crawford County · 1.8 mg/L · Soft
667116671266724†667346673566743667466675366756†667606676266763†66780†
Scott County · 1.2 mg/L · Soft
67871†
† 297 ZIP codes are not served by a mapped community water system — most are private-well areas. See well water hardness.
Source
Groundwater vs surface water
Kansas's groundwater measures harder than its surface water — 280 mg/L across 22,008 samples versus 260 across 79,007, about 1.1× harder. Wells draw from groundwater, so well owners in Kansas tend to see the harder number — 280 mg/L, very hard. Groundwater readings there run 137 to 600 mg/L across the middle 80% of samples. The comparison draws on 9,132 groundwater and 2,019 surface-water monitoring sites; 234 readings above 2,000 mg/L were logged but held out of the medians as outliers.
Groundwater (wells)
280 mg/L as CaCO₃ · 22,008 results at 9,132 stations.
Surface water (rivers, lakes)
260 mg/L as CaCO₃ · 79,007 results at 2,019 stations.
Groundwater measures about 1.1× harder than surface water here.
Chemistry
Water chemistry in Kansas
Beyond the hardness number, Kansas's water carries a fuller chemical signature — here is how its measured parameters compare to national benchmarks.
TDS
470 mg/L · n=6,776
470 mg/L — about 2.1× the national county median of 226, consistent with hard, mineral-rich water.
pH
7.9 pH · n=5,252
pH 7.9 — within the EPA secondary range of 6.5–8.5, on the alkaline side.
Alkalinity
197 mg/L as CaCO3 · n=28,932
197 mg/L — substantial buffering capacity, which resists pH swings.
Calcium : Magnesium
74 : 15 mg/L ≈ 4.93 : 1 · n=29,317
Calcium is about 75% of Kansas's hardness (74 mg/L Ca to 15 mg/L Mg), a little more calcium-rich than the national ~68% calcium share.
Parameter medians may include a small share of quality-control samples; the hardness lane is fully QC-filtered.
Aquifers
Major aquifers under Kansas
3 aquifer systems supply much of Kansas's measured groundwater.
- Alluvial aquifers — median 390 mg/L across 2,045 samples at 1,195 sites: very hard.
- Ozark Plateaus aquifer system — median 300 mg/L across 241 samples at 100 sites: very hard.
- Sand and gravel aquifers (glaciated regions) — median 300 mg/L across 260 samples at 163 sites: very hard.
Together these systems account for 2,546 measured samples at 1,458 sites. Aquifer medians pool samples across a whole system and can mask local variation — see the national aquifer map for how these compare across states.
Trend
Hardness over time
Kansas's decade median moved from 220 mg/L in the 1930s to 256.5 in the 2020s. Over the series, the decade median peaked at 300 mg/L in the 1940s and bottomed at 220 in the 1930s. Decade medians reflect where and what agencies sampled in each era, not just changes in the water itself.
Scale
Where Kansas sits on the scale
On the USGS scale, Kansas's 260 mg/L is very hard — 15.2 grains per gallon, well above the 180 mg/L very-hard cutoff — among the hardest water measured in the US.
At 260 mg/L (15.2 gpg), water-softener owners in Kansas typically set their unit to this hardness — settings calculator.
Questions
Frequently asked questions
- Is Kansas's water hard?
- Kansas's median hardness is 260 mg/L as CaCO₃, "very hard" on the USGS scale and 1.86× the national county median of 140 mg/L. About 98% of residents in measured counties have hard-or-worse water.
- Which county in Kansas has the hardest water?
- Hamilton County, with a median of 1500 mg/L as CaCO₃ across 874 measurements.
- Is well water harder than city water in Kansas?
- Groundwater measures harder here — about 1.1× the surface water — so wells tend to run harder (groundwater 280 vs surface water 260 mg/L).
- How do I find my exact hardness in Kansas?
- Search your ZIP on the lookup tool, read your utility's Consumer Confidence Report, or test at home with a kit.
- Is Kansas's water harder than the national average?
- Yes. Kansas's median of 260 mg/L is 1.86× the national county median of 140 mg/L, and Kansas ranks #9 of the 50 states and D.C.
Compare
States with similar hardness
Two states measure closest to Kansas's 260 mg/L: Oklahoma at 260 mg/L and Ohio at 270 mg/L. Kansas measures harder than 84% of states. Browse the full ranking on the statistics page.
More: hardness scale · check your address · national statistics · the national map.
By Marko Visic, MPharm, BSc Physics. Source: USGS/EPA Water Quality Portal — 103,475 Kansas measurements. Data last verified . Methodology.
Cite this page: “Kansas Water Hardness by County.” Hard Water Map. Retrieved 2026-07-22, https://hardwatermap.com/water-hardness/kansas/