Oklahoma Water Hardness by County
Water in Oklahoma has a median hardness of 260 mg/L as CaCO₃ — "very hard" on the USGS scale — based on 97,469 measurements at 6,695 monitoring stations. Harmon County has the state's hardest measured water (1780 mg/L); McCurtain County the softest (19.4). Rank: #10 of the 50 states and D.C.
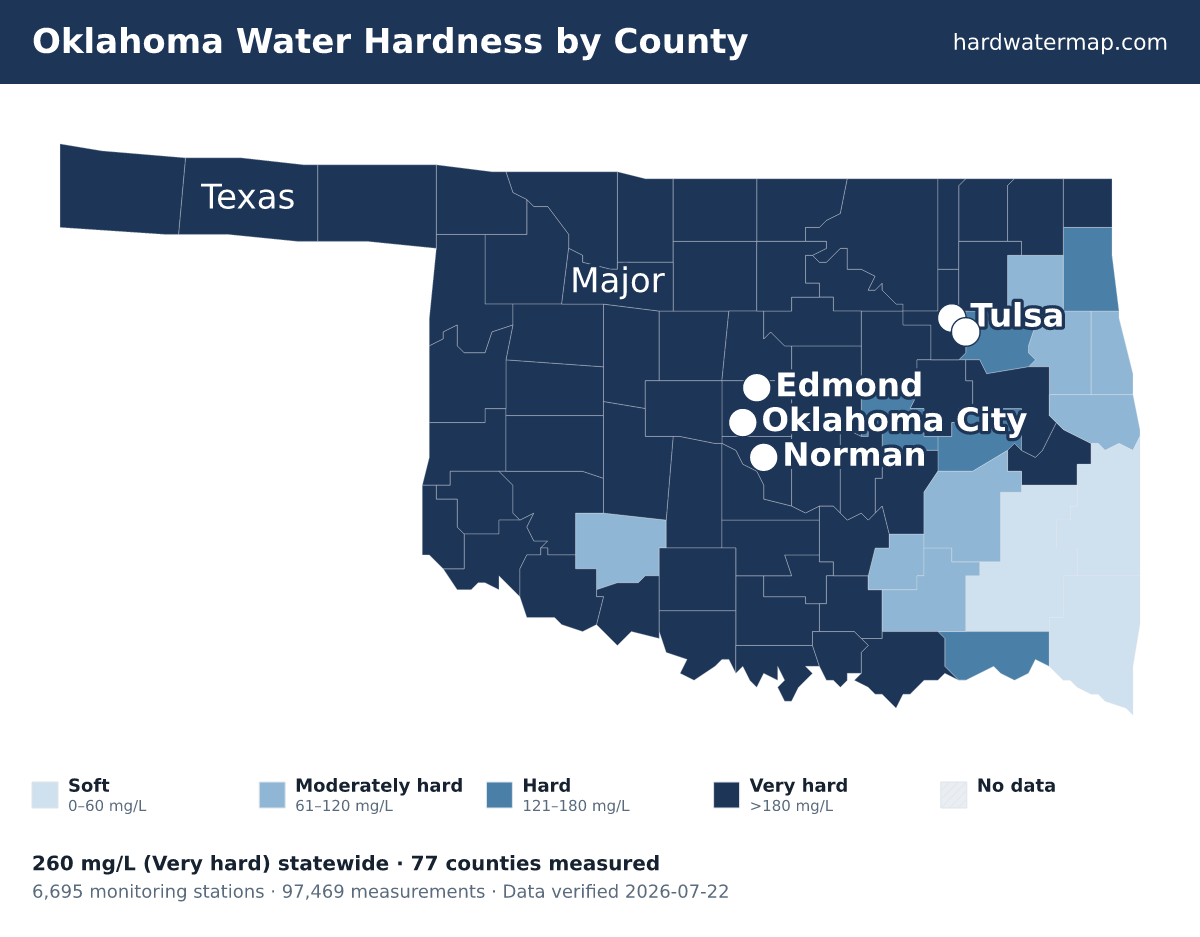
Oklahoma water hardness map — what the numbers mean. Data verified 2026-07-22.
Of Oklahoma's 77 measured counties, 60 very hard, 5 hard, 8 moderately hard, and 4 soft. The hardest are Harmon County (1780 mg/L), Dewey County (1700), and Jackson County (1470). McCurtain County is the softest at 19.4 mg/L (soft).
About 89% of Oklahoma's roughly 4 million residents in counties with gate-passing hardness data live where tap water is hard or worse.
Statewide, Oklahoma's median works out to 15.2 grains per gallon and ranks #10 of the 50 states and D.C. Across 97,469 measurements at 6,695 stations — 32,316 of them since 2000 — the middle 80% of readings fall between 79 and 850 mg/L. The public record runs from 1907 to 2026.
See where Oklahoma sits nationally on the national map, or what its number means on the hardness scale.
Download the Oklahoma water hardness map (PNG) — Water hardness by county in Oklahoma: 77 counties mapped from USGS/EPA data, statewide median 260 mg/L (very hard); darker counties have harder water.
By county
Water hardness by county
The table lists all 77 measured Oklahoma counties, hardest first. Their medians span 1780 mg/L in Harmon County to 19.4 in McCurtain County — a 91.8× range.
| County | Median | Band | Results | Sites | Newest |
|---|---|---|---|---|---|
| Harmon County | 1780 | Very hard | 778 | 43 | 2011 |
| Dewey County | 1700 | Very hard | 227 | 35 | 2023 |
| Jackson County | 1470 | Very hard | 422 | 115 | 2025 |
| Greer County | 1200 | Very hard | 866 | 58 | 2025 |
| Washita County | 1090 | Very hard | 322 | 51 | 2025 |
| Tillman County | 1009 | Very hard | 1,237 | 24 | 2025 |
| Woods County | 950 | Very hard | 1,060 | 78 | 2024 |
| Custer County | 870 | Very hard | 1,631 | 80 | 2025 |
| Beckham County | 860 | Very hard | 638 | 69 | 2025 |
| Alfalfa County | 650 | Very hard | 1,364 | 57 | 2024 |
| Kingfisher County | 650 | Very hard | 1,241 | 126 | 2024 |
| Woodward County | 590 | Very hard | 1,058 | 131 | 2024 |
| Kiowa County | 571 | Very hard | 1,471 | 90 | 2025 |
| Stephens County | 545 | Very hard | 306 | 29 | 2021 |
| Harper County | 540 | Very hard | 1,239 | 62 | 2024 |
| Love County | 530 | Very hard | 758 | 16 | 2025 |
| Caddo County | 510 | Very hard | 4,431 | 246 | 2025 |
| Major County | 510 | Very hard | 752 | 121 | 2024 |
| Jefferson County | 480 | Very hard | 650 | 22 | 2025 |
| Payne County | 460 | Very hard | 3,031 | 92 | 2024 |
| Roger Mills County | 450 | Very hard | 394 | 53 | 2025 |
| Cimarron County | 448 | Very hard | 204 | 71 | 2021 |
| Beaver County | 419.3 | Very hard | 1,124 | 60 | 2024 |
| Canadian County | 410.5 | Very hard | 717 | 168 | 2023 |
| Grady County | 400 | Very hard | 2,870 | 181 | 2025 |
| Blaine County | 390 | Very hard | 744 | 69 | 2018 |
| Garvin County | 390 | Very hard | 1,022 | 56 | 2025 |
| Grant County | 370 | Very hard | 401 | 57 | 2024 |
| McClain County | 370 | Very hard | 550 | 87 | 2025 |
| Seminole County | 362 | Very hard | 1,917 | 161 | 2025 |
| Carter County | 360 | Very hard | 2,030 | 19 | 2025 |
| Kay County | 340 | Very hard | 2,779 | 59 | 2024 |
| Logan County | 330 | Very hard | 1,650 | 189 | 2024 |
| Garfield County | 320 | Very hard | 313 | 50 | 2024 |
| Noble County | 308 | Very hard | 595 | 46 | 2024 |
| Murray County | 304 | Very hard | 1,782 | 128 | 2025 |
| Marshall County | 297 | Very hard | 145 | 8 | 2025 |
| Hughes County | 290 | Very hard | 2,888 | 21 | 2025 |
| Ellis County | 285.4 | Very hard | 252 | 57 | 2024 |
| Lincoln County | 280 | Very hard | 1,086 | 265 | 2025 |
| Pawnee County | 280 | Very hard | 2,141 | 30 | 2024 |
| Oklahoma County | 270 | Very hard | 3,120 | 496 | 2025 |
| Creek County | 266 | Very hard | 1,085 | 153 | 2025 |
| Pontotoc County | 260 | Very hard | 294 | 63 | 2025 |
| Tulsa County | 260 | Very hard | 3,881 | 22 | 2025 |
| Johnston County | 250 | Very hard | 962 | 103 | 2025 |
| Haskell County | 240 | Very hard | 3,024 | 92 | 2025 |
| Texas County | 240 | Very hard | 426 | 105 | 2021 |
| Pottawatomie County | 233 | Very hard | 478 | 236 | 2025 |
| Okmulgee County | 220 | Very hard | 2,234 | 13 | 2025 |
| Bryan County | 216.7 | Very hard | 926 | 34 | 2025 |
| Cleveland County | 210.5 | Very hard | 2,446 | 369 | 2025 |
| Cotton County | 200 | Very hard | 815 | 23 | 2025 |
| Nowata County | 200 | Very hard | 1,039 | 24 | 2023 |
| Craig County | 190.9 | Very hard | 686 | 78 | 2023 |
| Ottawa County | 190 | Very hard | 2,182 | 195 | 2023 |
| Osage County | 184 | Very hard | 1,909 | 267 | 2024 |
| Muskogee County | 180 | Very hard | 1,460 | 56 | 2025 |
| Rogers County | 180 | Very hard | 2,611 | 54 | 2013 |
| Washington County | 180 | Very hard | 1,149 | 15 | 2018 |
| McIntosh County | 166 | Hard | 400 | 18 | 2025 |
| Okfuskee County | 162.5 | Hard | 292 | 39 | 2025 |
| Choctaw County | 160.5 | Hard | 356 | 20 | 2025 |
| Wagoner County | 130 | Hard | 338 | 15 | 2023 |
| Delaware County | 120 | Hard | 2,394 | 109 | 2026 |
| Atoka County | 118.5 | Moderately hard | 1,036 | 68 | 2025 |
| Adair County | 110 | Moderately hard | 992 | 33 | 2025 |
| Coal County | 107 | Moderately hard | 475 | 44 | 2025 |
| Mayes County | 104.5 | Moderately hard | 1,494 | 37 | 2025 |
| Cherokee County | 100 | Moderately hard | 1,749 | 53 | 2025 |
| Sequoyah County | 81.5 | Moderately hard | 1,302 | 31 | 2025 |
| Comanche County | 78 | Moderately hard | 392 | 104 | 2025 |
| Pittsburg County | 66 | Moderately hard | 841 | 57 | 2025 |
| Le Flore County | 36 | Soft | 2,531 | 117 | 2026 |
| Latimer County | 33 | Soft | 436 | 37 | 2025 |
| Pushmataha County | 20 | Soft | 944 | 47 | 2025 |
| McCurtain County | 19.4 | Soft | 1,684 | 88 | 2025 |
ZIP codes
ZIP codes in Oklahoma
The ZIP codes below are grouped by the Oklahoma county each mostly falls within (by land area). Each ZIP takes that county's measured median — shown in the group header — so this is a ZIP-to-county guide, not a separate reading for every ZIP. To check the water system serving a specific address, use the lookup.
Key: a † after a ZIP means it has no mapped community water system — usually a private-well area. Plain ZIPs are served by a mapped community water system.
Harmon County · 1780 mg/L · Very hard
735447355073571
Dewey County · 1700 mg/L · Very hard
73658†7365973663†7366773724†7383573859†
Jackson County · 1470 mg/L · Very hard
73521735237352673532†7353773539735497355673560†
Greer County · 1200 mg/L · Very hard
73547†73554†73673
Washita County · 1090 mg/L · Very hard
730217302473622†73624†73626736327364173647†7366173664
Tillman County · 1009 mg/L · Very hard
73530†7354273546735517355373555†73570†
Woods County · 950 mg/L · Very hard
73716†7371773731†7374673842†73860†
Custer County · 870 mg/L · Very hard
730967360173620736257363973669
Beckham County · 860 mg/L · Very hard
73627736447364573662†73668
Alfalfa County · 650 mg/L · Very hard
73719†7372273726†7372873739†73741†73749†
Kingfisher County · 650 mg/L · Very hard
7301673734†73742†737507375673764
Woodward County · 590 mg/L · Very hard
73801†73852†7385373857†
Kiowa County · 571 mg/L · Very hard
730417306273559†73564735667365173655
Stephens County · 545 mg/L · Very hard
7305573425†73434†7344273491†7352973533
Harper County · 540 mg/L · Very hard
7383473855†
Love County · 530 mg/L · Very hard
73430†73441†734487345373459
Caddo County · 510 mg/L · Very hard
73001†730057300673009†73015730177302973033†730387304273047†73048†73053†
Major County · 510 mg/L · Very hard
73718737297373773747†737607376873838†
Jefferson County · 480 mg/L · Very hard
73456735207356573569†73573
Payne County · 460 mg/L · Very hard
740237403274059†74062†74074†74075740777407874085
Roger Mills County · 450 mg/L · Very hard
73628†7363873642†736507365473660†73666
Cimarron County · 448 mg/L · Very hard
73933†73937†73946†73947†
Beaver County · 419.3 mg/L · Very hard
73844†73848†73931†73932†73938†73950†
Canadian County · 410.5 mg/L · Very hard
730147302273036†73064†730787309073099†73762
Grady County · 400 mg/L · Very hard
73002†73004†73010†73011†7301873059†730677307973082†7308973092
Blaine County · 390 mg/L · Very hard
73040†73043†73646†7374473755†7376373770†73772†
Garvin County · 390 mg/L · Very hard
73052730577307473075730987343374872†
Grant County · 370 mg/L · Very hard
73758†737597376173766737717463674643
McClain County · 370 mg/L · Very hard
730317306573080730937309574831†
Seminole County · 362 mg/L · Very hard
74830748377484074849†74867†7486874884
Carter County · 360 mg/L · Very hard
73401734357343673437†734387344373444†73458†734637348173487†73488
Kay County · 340 mg/L · Very hard
74601†746317463274641746467464774653
Logan County · 330 mg/L · Very hard
7302573027†730287304473050†73058†73063
Garfield County · 320 mg/L · Very hard
7305673701†73703737057372073727†73730†73733†73735†73736737387374373753737547377374640
Noble County · 308 mg/L · Very hard
73061730737307773757746307464474651†
Murray County · 304 mg/L · Very hard
73030†73032†73086
Marshall County · 297 mg/L · Very hard
7343973440†73446
Hughes County · 290 mg/L · Very hard
745317457074827748397484874850†74883
Ellis County · 285.4 mg/L · Very hard
73832†73840†73841†73843†73851†73858†
Lincoln County · 280 mg/L · Very hard
74026†740797482474832†7483474855†7486474869†7487574881†
Pawnee County · 280 mg/L · Very hard
7402074034740457405874081†
Oklahoma County · 270 mg/L · Very hard
7300373007†7300873012730137302073034†73045†730497305473066†73084†73097†73102731037310473105731067310773108731097311073111731127311473115731167311773118731197312073121†731227312773128†731297313073131†731327313473135†7313973141†73142731457314973150†73151731597316273169†73179
Creek County · 266 mg/L · Very hard
74010†74028†7403074038†74039740417404474046†74050†740527406674068†7407174131
Pontotoc County · 260 mg/L · Very hard
74820748257484274843†7484474865†74871
Tulsa County · 260 mg/L · Very hard
74008740117401274021740337403774055740637410374104741057410674107†74108741107411274114741157411674117†7411974120741287412974130†741327413374134741357413674137741457414674171
Johnston County · 250 mg/L · Very hard
7343273447†73450734557346073461†74530†74748†74836†74856
Haskell County · 240 mg/L · Very hard
744627447274552749417494374944†
Texas County · 240 mg/L · Very hard
7390173939†73942†73944†73945†73949†73951†
Pottawatomie County · 233 mg/L · Very hard
748017480474826†748517485274854†7486674873†74878†
Okmulgee County · 220 mg/L · Very hard
740477442174431744377444574447†7445674460
Bryan County · 216.7 mg/L · Very hard
734497470174720†7472174723†74726†74729†74730747317473374741†74747†74753
Cleveland County · 210.5 mg/L · Very hard
73019†73026†73051†73068†73069†73070†7307173072†7316073165†7317073173†74857†
Cotton County · 200 mg/L · Very hard
735287353173548735627356873572
Nowata County · 200 mg/L · Very hard
7402774042740487407274083
Craig County · 190.9 mg/L · Very hard
743017433274333†7434974369†
Ottawa County · 190 mg/L · Very hard
74339†74343†7435474358743607436374370†
Osage County · 184 mg/L · Very hard
740017400274003†74035†74054†74056†74060†74070†74073†74084†74126†741277460474633†74637†74650†74652
Muskogee County · 180 mg/L · Very hard
744017440374422†744237443474436744507445574463†744687446974470†
Rogers County · 180 mg/L · Very hard
74015740167401774019740367405374080
Washington County · 180 mg/L · Very hard
7400674022†7402974051†74061†74082
McIntosh County · 166 mg/L · Hard
744267442874432744387445974845†
Okfuskee County · 162.5 mg/L · Hard
74829748337485974860†74880
Choctaw County · 160.5 mg/L · Hard
7472774735†74738†7474374756†74759†74761
Wagoner County · 130 mg/L · Hard
7401474429†7444674454744587446774477
Delaware County · 120 mg/L · Hard
7433174338†743427434474346†743477435974364†74368†
Atoka County · 118.5 mg/L · Moderately hard
74525†7453374540†745557456974576†
Adair County · 110 mg/L · Moderately hard
749317496074964†74965†
Coal County · 107 mg/L · Moderately hard
74534†745357453874556†74572†
Mayes County · 104.5 mg/L · Moderately hard
743307433774340743507435274361†7436574366†74367
Cherokee County · 100 mg/L · Moderately hard
74427†7444174451†74452†74457†7446474471
Sequoyah County · 81.5 mg/L · Moderately hard
7443574936749457494674948749547495574962
Comanche County · 78 mg/L · Moderately hard
7350173503†7350573507†735277353873540†73541†73543735527355773567
Pittsburg County · 66 mg/L · Moderately hard
744257443074442745017452274528†7454674547†745537455474560†7456174565
Le Flore County · 36 mg/L · Soft
74549†74577†74901†74902749307493274935749377493974940749427494774949749517495374956†74957†74959†74966
Latimer County · 33 mg/L · Soft
745637457174578
Pushmataha County · 20 mg/L · Soft
7452174523745367454374557†7455874562†74567†74574†74760
McCurtain County · 19.4 mg/L · Soft
74722†74724†74728†74734†74736747377474074745747507475474755†74764†74766†74963†
† 241 ZIP codes are not served by a mapped community water system — most are private-well areas. See well water hardness.
Source
Groundwater vs surface water
Oklahoma's surface water measures harder than its groundwater — 265 mg/L across 92,013 samples versus 230 across 5,415, about 1.2× harder. For well owners that is the better side of a hard bargain: at 230 mg/L, Oklahoma groundwater is still very hard, and most of the state's drinking water is pumped from it. Groundwater readings there run 40.3 to 700 mg/L across the middle 80% of samples. The comparison draws on 3,977 groundwater and 2,709 surface-water monitoring sites; 2,700 readings above 2,000 mg/L were logged but held out of the medians as outliers.
Groundwater (wells)
230 mg/L as CaCO₃ · 5,415 results at 3,977 stations.
Surface water (rivers, lakes)
265 mg/L as CaCO₃ · 92,013 results at 2,709 stations.
Surface water measures about 1.2× harder than groundwater here.
Chemistry
Water chemistry in Oklahoma
Beyond the hardness number, Oklahoma's water carries a fuller chemical signature — here is how its measured parameters compare to national benchmarks.
TDS
140.1 mg/L · n=18,213
140.1 mg/L — below the national county median of 226.
pH
8 pH · n=23,144
pH 8 — within the EPA secondary range of 6.5–8.5, on the alkaline side.
Alkalinity
134 mg/L as CaCO3 · n=57,663
134 mg/L — substantial buffering capacity, which resists pH swings.
Calcium : Magnesium
48 : 9.9 mg/L ≈ 4.85 : 1 · n=4,374
Calcium is about 75% of Oklahoma's hardness (48 mg/L Ca to 9.9 mg/L Mg), a little more calcium-rich than the national ~68% calcium share.
Parameter medians may include a small share of quality-control samples; the hardness lane is fully QC-filtered.
Aquifers
Major aquifers under Oklahoma
3 aquifer systems supply much of Oklahoma's measured groundwater.
- Blaine aquifer — median 1650 mg/L across 67 samples at 64 sites: very hard.
- Alluvial aquifers — median 320 mg/L across 980 samples at 924 sites: very hard.
- Arbuckle-Simpson aquifer — median 320 mg/L across 160 samples at 126 sites: very hard.
Together these systems account for 1,207 measured samples at 1,114 sites. Aquifer medians pool samples across a whole system and can mask local variation — see the national aquifer map for how these compare across states.
Trend
Hardness over time
Oklahoma's decade median moved from 280 mg/L in the 1940s to 193 in the 2020s. Over the series, the decade median peaked at 310 mg/L in the 1970s and bottomed at 193 in the 2020s. Decade medians reflect where and what agencies sampled in each era, not just changes in the water itself.
Scale
Where Oklahoma sits on the scale
On the USGS scale, Oklahoma's 260 mg/L is very hard — 15.2 grains per gallon, well above the 180 mg/L very-hard cutoff — among the hardest water measured in the US.
At 260 mg/L (15.2 gpg), water-softener owners in Oklahoma typically set their unit to this hardness — settings calculator.
Questions
Frequently asked questions
- Is Oklahoma's water hard?
- Oklahoma's median hardness is 260 mg/L as CaCO₃, "very hard" on the USGS scale and 1.86× the national county median of 140 mg/L. About 89% of residents in measured counties have hard-or-worse water.
- Which county in Oklahoma has the hardest water?
- Harmon County, with a median of 1780 mg/L as CaCO₃ across 778 measurements.
- Is well water harder than city water in Oklahoma?
- Surface water measures harder here — about 1.2× the groundwater — so wells tend to run softer (groundwater 230 vs surface water 265 mg/L).
- How do I find my exact hardness in Oklahoma?
- Search your ZIP on the lookup tool, read your utility's Consumer Confidence Report, or test at home with a kit.
- Is Oklahoma's water harder than the national average?
- Yes. Oklahoma's median of 260 mg/L is 1.86× the national county median of 140 mg/L, and Oklahoma ranks #10 of the 50 states and D.C.
Compare
States with similar hardness
Two states measure closest to Oklahoma's 260 mg/L: Kansas at 260 mg/L and Ohio at 270 mg/L. Oklahoma measures harder than 82% of states. Browse the full ranking on the statistics page.
More: hardness scale · check your address · national statistics · the national map.
By Marko Visic, MPharm, BSc Physics. Source: USGS/EPA Water Quality Portal — 97,469 Oklahoma measurements. Data last verified . Methodology.
Cite this page: “Oklahoma Water Hardness by County.” Hard Water Map. Retrieved 2026-07-22, https://hardwatermap.com/water-hardness/oklahoma/