Maryland Water Hardness by County
Water in Maryland has a median hardness of 58 mg/L as CaCO₃ — "soft" on the USGS scale — based on 14,908 measurements at 4,673 monitoring stations. Washington County has the state's hardest measured water (165 mg/L); Charles County the softest (12.4). Rank: #35 of the 50 states and D.C.
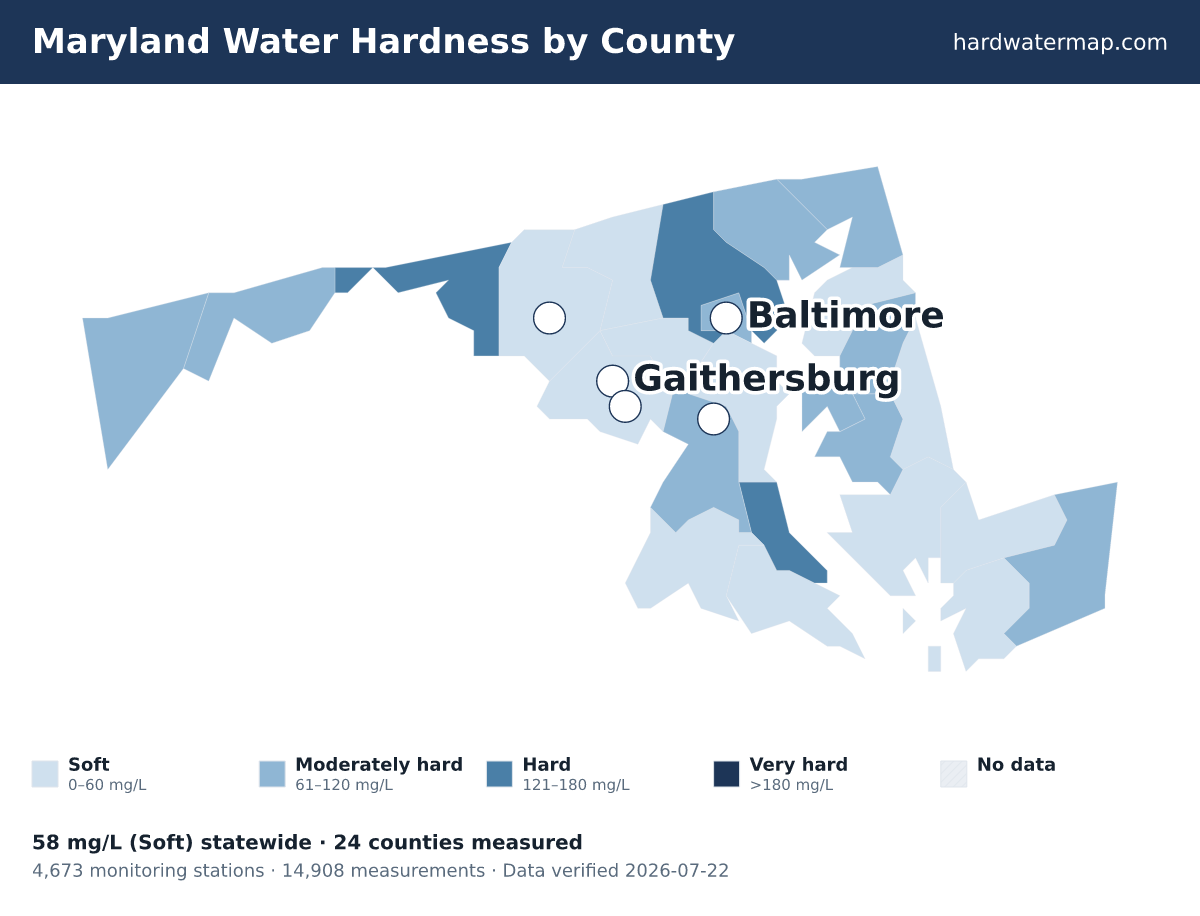
Maryland water hardness map — what the numbers mean. Data verified 2026-07-22.
Of Maryland's 24 measured counties, 3 hard, 9 moderately hard, and 12 soft. The hardest are Washington County (165 mg/L), Baltimore County (132), and Calvert County (131). Charles County is the softest at 12.4 mg/L (soft).
About 18% of Maryland's roughly 6.2 million residents in counties with gate-passing hardness data live where tap water is hard or worse.
Statewide, Maryland's median works out to 3.4 grains per gallon and ranks #35 of the 50 states and D.C. Across 14,908 measurements at 4,673 stations — 4,736 of them since 2000 — the middle 80% of readings fall between 6.5 and 209 mg/L. The public record runs from 1906 to 2025.
See where Maryland sits nationally on the national map, or what its number means on the hardness scale.
Download the Maryland water hardness map (PNG) — Water hardness by county in Maryland: 24 counties mapped from USGS/EPA data, statewide median 58 mg/L (soft); darker counties have harder water.
By county
Water hardness by county
The table lists all 24 measured Maryland counties, hardest first. Their medians span 165 mg/L in Washington County to 12.4 in Charles County — a 13.3× range.
| County | Median | Band | Results | Sites | Newest |
|---|---|---|---|---|---|
| Washington County | 165 | Hard | 1,526 | 271 | 2022 |
| Baltimore County | 132 | Hard | 764 | 399 | 2019 |
| Calvert County | 131 | Hard | 253 | 112 | 2016 |
| Allegany County | 110 | Moderately hard | 593 | 72 | 2022 |
| Baltimore County | 91.4 | Moderately hard | 117 | 97 | 2000 |
| Cecil County | 88 | Moderately hard | 527 | 143 | 2024 |
| Worcester County | 76 | Moderately hard | 590 | 195 | 2023 |
| Harford County | 72.6 | Moderately hard | 932 | 252 | 2023 |
| Prince George's County | 71 | Moderately hard | 387 | 123 | 2016 |
| Queen Anne's County | 62.3 | Moderately hard | 353 | 163 | 2023 |
| Garrett County | 61.8 | Moderately hard | 788 | 228 | 2023 |
| Talbot County | 61 | Moderately hard | 88 | 69 | 2023 |
| Kent County | 57.6 | Soft | 809 | 206 | 2023 |
| Carroll County | 51.6 | Soft | 463 | 206 | 2022 |
| Somerset County | 47.2 | Soft | 142 | 118 | 2023 |
| Montgomery County | 43 | Soft | 312 | 118 | 2022 |
| Howard County | 40.3 | Soft | 275 | 148 | 2019 |
| Anne Arundel County | 40 | Soft | 767 | 419 | 2023 |
| Caroline County | 38 | Soft | 521 | 117 | 2023 |
| Dorchester County | 37.2 | Soft | 493 | 138 | 2025 |
| St. Mary's County | 28.5 | Soft | 293 | 132 | 2022 |
| Frederick County | 28 | Soft | 3,106 | 616 | 2022 |
| Wicomico County | 20 | Soft | 345 | 147 | 2023 |
| Charles County | 12.4 | Soft | 464 | 184 | 2022 |
ZIP codes
ZIP codes in Maryland
The ZIP codes below are grouped by the Maryland county each mostly falls within (by land area). Each ZIP takes that county's measured median — shown in the group header — so this is a ZIP-to-county guide, not a separate reading for every ZIP. To check the water system serving a specific address, use the lookup.
Key: a † after a ZIP means it has no mapped community water system — usually a private-well area. Plain ZIPs are served by a mapped community water system.
Washington County · 165 mg/L · Hard
21711†21713†21715†2171921722†21733†217342174021742†21746†21750†21756†2176721779†21781†2178221783†21795†
Baltimore County · 132 mg/L · Hard
21013†21023†210302103121051†2105221053†21057†21071†21082†21087†2109321105†21111†2111721120†2112821131†2113321136†21152†21153†21155†21156†2116221163†21204212072120821209212192122021221†21222212272122821234212362123721244†21250212522128521286
Calvert County · 131 mg/L · Hard
20615†2062920639†20657†20676†20678†20685†2068820689†20732†20736†20754†
Allegany County · 110 mg/L · Moderately hard
2150221524†21529†21530†21532†2154021542†21543†2154521555†21557†21560†21766†
Baltimore County · 91.4 mg/L · Moderately hard
212012120221205212062121021211212122121321214212152121621217212182122321224212262122921230†2123121233212392125121287
Cecil County · 88 mg/L · Moderately hard
21901†2190221903†21904†21911†21912†21913†2191421915†21917†21918†21919†21920†2192121930†
Worcester County · 76 mg/L · Moderately hard
2181121813†21829†21841†21842†21851†21862†21863†21864†21872†
Harford County · 72.6 mg/L · Moderately hard
21001†210052100921010†2101421015†2101721028†21034†2104021047†21050†21078†21084†21085†21130†21132†21154†21160†21161†
Prince George's County · 71 mg/L · Moderately hard
2060720608†20613†206232070520706207072070820710207122071520716†207202072120722207352073720740207422074320744207452074620747207482076220769207702077120772†207742078120782207832078420785
Queen Anne's County · 62.3 mg/L · Moderately hard
21607†21617†21619†21623†2162821638†21644†21649†21657†21658†21666†21668
Garrett County · 61.8 mg/L · Moderately hard
21520†21521†21523†21531†21536†21538†21539†215412155021561†21562†
Talbot County · 61 mg/L · Moderately hard
2160121612†21624†21625†21647†21652†21653†21654†21662†21663†21665†21671†21673†21676†21679†
Kent County · 57.6 mg/L · Soft
2161021620†21635†21645†21650†21651†21661†21667†21678†
Carroll County · 51.6 mg/L · Soft
21048†21074†21102†21157†21158†21757†21776†21784†21787†
Somerset County · 47.2 mg/L · Soft
2181721821†21824†21838†2185321866†21867†21871†21890
Montgomery County · 43 mg/L · Soft
20812†20814208152081620817208182083220833†20837†20838†20839†20841†20842†208502085120852208532085420855208602086120862†208662086820871†2087220874†208762087720878208792088020882†208862088920892208942089520896208992090120902209032090420905209062091020912
Howard County · 40.3 mg/L · Soft
2070120723†20759†2076320777†20794†21029†21036†21042†210432104421045210462107521104†21723†21737†21738†21794†21797†
Anne Arundel County · 40 mg/L · Soft
20711†20714†20724†20733†20751†2075520758†20764†20765†20776†20778†20779†2101221032†21035†21037†2105421056210602106121076210772109021108211132111421122†2114021144211462122521240214012140221403†21405†21409
Caroline County · 38 mg/L · Soft
21629†21632†21636†21639†21640†21641†21655†21660
Dorchester County · 37.2 mg/L · Soft
21613†21622†21626†21627†21631†21634†21643†21648†21659†2166421669†21672†21675†21677†21835†21869†
St. Mary's County · 28.5 mg/L · Soft
20606†20609†20618†20619†20620†20621†20624†20626†20628†20630†2063420636†20650†20653†20656†20659†20660†20667†2067020674†20680†20684†20686†20687†2069020692†
Frederick County · 28 mg/L · Soft
21701†21702†21703†21704†2170521710†21714†2171621717†21718†21727†21754†21755†21758†21762†21769†21770†21771†21773†21774†2177721778†21780†21788†21790†21791†2179321798†
Wicomico County · 20 mg/L · Soft
21801†21804†21810†21814†218222182621830†21837†21840†21849†21850†21856†21861†21865†2187421875†
Charles County · 12.4 mg/L · Soft
20601†20602†2060320611†20612†20616†20617†20622†20625†20632†20637†20640†20645†20646†20658†20661†20662†20664†20675†20677†20693†20695†
† 294 ZIP codes are not served by a mapped community water system — most are private-well areas. See well water hardness.
Source
Groundwater vs surface water
Maryland's groundwater measures harder than its surface water — 62 mg/L across 5,738 samples versus 58 across 8,876, about 1.1× harder. Wells draw from groundwater, so well owners in Maryland tend to see the harder number — 62 mg/L, moderately hard. Groundwater readings there run 8 to 269 mg/L across the middle 80% of samples. The comparison draws on 3,518 groundwater and 1,144 surface-water monitoring sites; 63 readings above 2,000 mg/L were logged but held out of the medians as outliers.
Groundwater (wells)
62 mg/L as CaCO₃ · 5,738 results at 3,518 stations.
Surface water (rivers, lakes)
58 mg/L as CaCO₃ · 8,876 results at 1,144 stations.
Groundwater measures about 1.1× harder than surface water here.
Chemistry
Water chemistry in Maryland
Beyond the hardness number, Maryland's water carries a fuller chemical signature — here is how its measured parameters compare to national benchmarks.
TDS
135 mg/L · n=3,102
135 mg/L — below the national county median of 226.
pH
7.4 pH · n=3,907
pH 7.4 — within the EPA secondary range of 6.5–8.5, on the alkaline side.
Alkalinity
45 mg/L as CaCO3 · n=5,421
45 mg/L — modest buffering capacity.
Calcium : Magnesium
20.3 : 6.8 mg/L ≈ 2.99 : 1 · n=4,874
Calcium is about 64% of Maryland's hardness (20.3 mg/L Ca to 6.8 mg/L Mg), a little more magnesium-rich than the national ~68% calcium share.
Parameter medians may include a small share of quality-control samples; the hardness lane is fully QC-filtered.
Aquifers
Major aquifers under Maryland
3 aquifer systems supply much of Maryland's measured groundwater.
- Alluvial aquifers — median 287 mg/L across 127 samples at 40 sites: very hard.
- Valley and Ridge aquifers — median 230 mg/L across 274 samples at 231 sites: very hard.
- Piedmont and Blue Ridge carbonate-rock aquifers — median 200 mg/L across 200 samples at 131 sites: very hard.
Together these systems account for 601 measured samples at 402 sites. Aquifer medians pool samples across a whole system and can mask local variation — see the national aquifer map for how these compare across states.
Trend
Hardness over time
Maryland's decade median moved from 42.5 mg/L in the 1940s to 82 in the 2020s. Over the series, the decade median peaked at 82 mg/L in the 2020s and bottomed at 37.8 in the 1980s. Decade medians reflect where and what agencies sampled in each era, not just changes in the water itself.
Scale
Where Maryland sits on the scale
On the USGS scale, Maryland's 58 mg/L is soft — 3.4 grains per gallon, below the 60 mg/L soft cutoff — among the softest water measured in the US.
Questions
Frequently asked questions
- Is Maryland's water hard?
- Maryland's median hardness is 58 mg/L as CaCO₃, "soft" on the USGS scale and below the national county median of 140 mg/L.
- Which county in Maryland has the hardest water?
- Washington County, with a median of 165 mg/L as CaCO₃ across 1,526 measurements.
- Is well water harder than city water in Maryland?
- Groundwater measures harder here — about 1.1× the surface water — so wells tend to run harder (groundwater 62 vs surface water 58 mg/L).
- How do I find my exact hardness in Maryland?
- Search your ZIP on the lookup tool, read your utility's Consumer Confidence Report, or test at home with a kit.
- Is Maryland's water harder than the national average?
- No. Maryland's median of 58 mg/L is below the national county median of 140 mg/L; it ranks #35 of the 50 states and D.C.
Compare
States with similar hardness
Two states measure closest to Maryland's 58 mg/L: New Jersey at 59.9 mg/L and Arkansas at 62 mg/L. Maryland measures harder than 32% of states. Browse the full ranking on the statistics page.
More: hardness scale · check your address · national statistics · the national map.
By Marko Visic, MPharm, BSc Physics. Source: USGS/EPA Water Quality Portal — 14,908 Maryland measurements. Data last verified . Methodology.
Cite this page: “Maryland Water Hardness by County.” Hard Water Map. Retrieved 2026-07-22, https://hardwatermap.com/water-hardness/maryland/