Michigan Water Hardness by County
Water in Michigan has a median hardness of 168 mg/L as CaCO₃ — "hard" on the USGS scale — based on 21,097 measurements at 4,874 monitoring stations. Huron County has the state's hardest measured water (350 mg/L); Gogebic County the softest (47.1). Rank: #17 of the 50 states and D.C.
Michigan water hardness map — what the numbers mean. Data verified 2026-07-22.
Of Michigan's 82 measured counties, 39 very hard, 27 hard, 12 moderately hard, and 4 soft. The hardest are Huron County (350 mg/L), Isabella County (344.5), and Sanilac County (340). Gogebic County is the softest at 47.1 mg/L (soft).
About 78% of Michigan's roughly 10 million residents in counties with gate-passing hardness data live where tap water is hard or worse.
Statewide, Michigan's median works out to 9.8 grains per gallon and ranks #17 of the 50 states and D.C. Across 21,097 measurements at 4,874 stations — 10,532 of them since 2000 — the middle 80% of readings fall between 45.5 and 320 mg/L. The public record runs from 1901 to 2026.
See where Michigan sits nationally on the national map, or what its number means on the hardness scale.
Download the Michigan water hardness map (PNG) — Water hardness by county in Michigan: 82 counties mapped from USGS/EPA data, statewide median 168 mg/L (hard); darker counties have harder water.
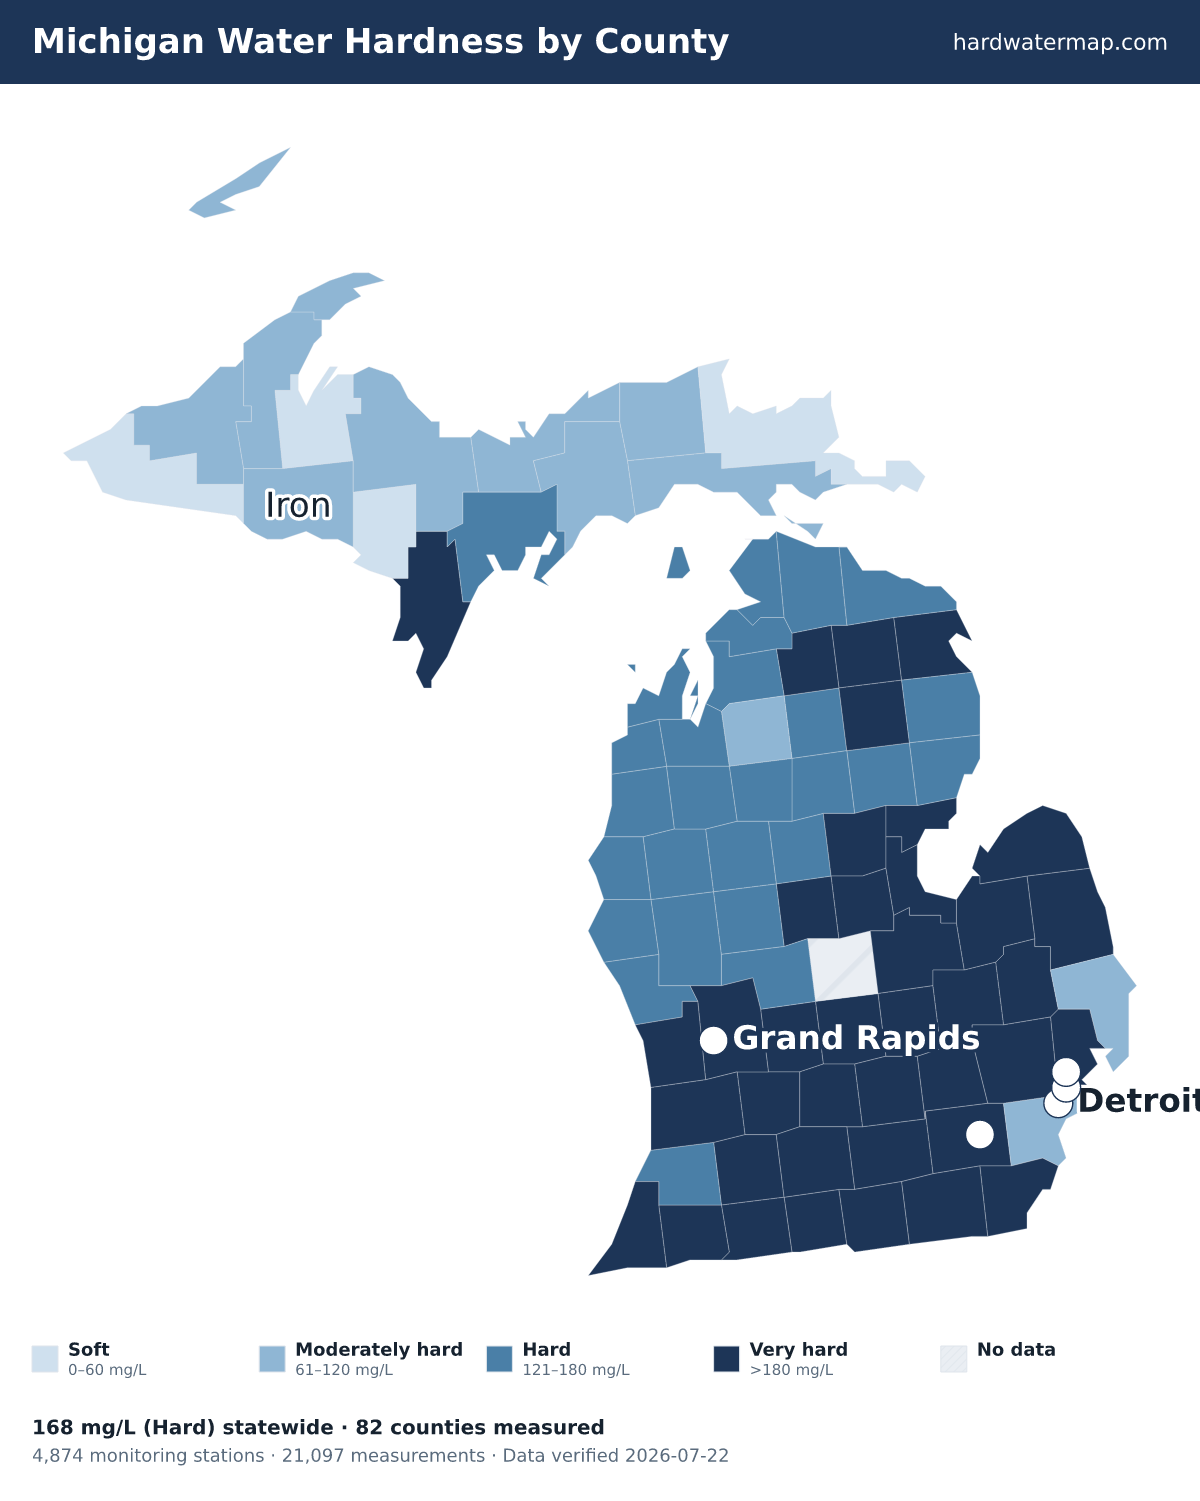
By county
Water hardness by county
The table lists all 82 measured Michigan counties, hardest first. Their medians span 350 mg/L in Huron County to 47.1 in Gogebic County — a 7.4× range. 1 more Michigan county lacks gate-passing data.
| County | Median | Band | Results | Sites | Newest |
|---|---|---|---|---|---|
| Huron County | 350 | Very hard | 181 | 74 | 1998 |
| Isabella County | 344.5 | Very hard | 26 | 24 | 2007 |
| Sanilac County | 340 | Very hard | 79 | 43 | 2016 |
| Ingham County | 324 | Very hard | 287 | 218 | 2016 |
| Eaton County | 322 | Very hard | 114 | 104 | 2013 |
| Lenawee County | 320 | Very hard | 88 | 52 | 2016 |
| Monroe County | 318 | Very hard | 416 | 132 | 2014 |
| Clinton County | 300 | Very hard | 208 | 173 | 2008 |
| Shiawassee County | 295 | Very hard | 35 | 28 | 1997 |
| Ionia County | 290 | Very hard | 125 | 39 | 2013 |
| Lapeer County | 286 | Very hard | 86 | 55 | 2016 |
| Hillsdale County | 280 | Very hard | 110 | 68 | 2016 |
| Washtenaw County | 280 | Very hard | 693 | 271 | 2016 |
| Livingston County | 277 | Very hard | 191 | 86 | 2016 |
| Branch County | 270 | Very hard | 175 | 79 | 2022 |
| Calhoun County | 270 | Very hard | 56 | 37 | 2009 |
| Oakland County | 270 | Very hard | 941 | 490 | 2023 |
| Macomb County | 265 | Very hard | 814 | 70 | 2023 |
| Berrien County | 260 | Very hard | 259 | 11 | 2022 |
| Jackson County | 260 | Very hard | 105 | 69 | 2022 |
| Kalamazoo County | 260 | Very hard | 528 | 148 | 2013 |
| Ottawa County | 260 | Very hard | 389 | 27 | 2014 |
| Saginaw County | 259.5 | Very hard | 612 | 65 | 2015 |
| Allegan County | 250 | Very hard | 436 | 29 | 2014 |
| St. Joseph County | 250 | Very hard | 98 | 23 | 2013 |
| Midland County | 248 | Very hard | 86 | 31 | 2007 |
| Bay County | 240 | Very hard | 200 | 32 | 2013 |
| Kent County | 230 | Very hard | 43 | 41 | 2009 |
| Tuscola County | 230 | Very hard | 33 | 30 | 2008 |
| Cass County | 220 | Very hard | 34 | 26 | 2022 |
| Genesee County | 220 | Very hard | 112 | 67 | 2012 |
| Menominee County | 220 | Very hard | 614 | 47 | 2025 |
| Arenac County | 210 | Very hard | 177 | 16 | 2014 |
| Barry County | 200 | Very hard | 47 | 47 | 2009 |
| Gladwin County | 200 | Very hard | 34 | 24 | 2013 |
| Montmorency County | 190 | Very hard | 30 | 22 | 2010 |
| Otsego County | 190 | Very hard | 49 | 30 | 2010 |
| Oscoda County | 186 | Very hard | 21 | 9 | 2012 |
| Alpena County | 180 | Very hard | 195 | 8 | 2013 |
| Antrim County | 170 | Hard | 22 | 20 | 2023 |
| Emmet County | 170 | Hard | 9 | 7 | 2010 |
| Montcalm County | 170 | Hard | 37 | 37 | 2008 |
| Manistee County | 164 | Hard | 2,142 | 61 | 2026 |
| Cheboygan County | 160 | Hard | 238 | 25 | 2013 |
| Grand Traverse County | 160 | Hard | 193 | 91 | 2013 |
| Lake County | 160 | Hard | 37 | 27 | 2010 |
| Leelanau County | 160 | Hard | 68 | 48 | 2013 |
| Mason County | 160 | Hard | 162 | 20 | 2013 |
| Muskegon County | 160 | Hard | 97 | 37 | 2011 |
| Newaygo County | 160 | Hard | 355 | 36 | 2013 |
| Oceana County | 160 | Hard | 17 | 15 | 2014 |
| Ogemaw County | 160 | Hard | 42 | 32 | 2009 |
| Osceola County | 160 | Hard | 91 | 15 | 2013 |
| Benzie County | 150 | Hard | 46 | 34 | 2013 |
| Charlevoix County | 150 | Hard | 11 | 11 | 2010 |
| Crawford County | 150 | Hard | 53 | 39 | 2007 |
| Iosco County | 150 | Hard | 343 | 30 | 2013 |
| Van Buren County | 150 | Hard | 217 | 160 | 2009 |
| Wexford County | 150 | Hard | 25 | 17 | 2009 |
| Presque Isle County | 145 | Hard | 16 | 15 | 2010 |
| Mecosta County | 140 | Hard | 27 | 27 | 2008 |
| Missaukee County | 132 | Hard | 11 | 11 | 2006 |
| Delta County | 130 | Hard | 714 | 166 | 2015 |
| Alcona County | 120 | Hard | 10 | 10 | 2007 |
| Clare County | 120 | Hard | 23 | 23 | 2013 |
| Roscommon County | 120 | Hard | 12 | 12 | 2007 |
| Wayne County | 110 | Moderately hard | 645 | 51 | 2021 |
| Kalkaska County | 105 | Moderately hard | 16 | 16 | 2009 |
| Mackinac County | 100 | Moderately hard | 85 | 14 | 2013 |
| St. Clair County | 100 | Moderately hard | 529 | 83 | 2016 |
| Alger County | 93 | Moderately hard | 168 | 86 | 2023 |
| Schoolcraft County | 91 | Moderately hard | 322 | 50 | 2014 |
| Iron County | 72.5 | Moderately hard | 56 | 43 | 2023 |
| Luce County | 71.6 | Moderately hard | 154 | 14 | 2010 |
| Keweenaw County | 67 | Moderately hard | 227 | 21 | 2023 |
| Houghton County | 66 | Moderately hard | 122 | 29 | 2024 |
| Ontonagon County | 64.8 | Moderately hard | 323 | 17 | 2024 |
| Marquette County | 60.5 | Moderately hard | 1,249 | 247 | 2017 |
| Dickinson County | 53 | Soft | 191 | 47 | 2010 |
| Baraga County | 50 | Soft | 1,784 | 110 | 2025 |
| Chippewa County | 48 | Soft | 1,354 | 103 | 2016 |
| Gogebic County | 47.1 | Soft | 103 | 49 | 2014 |
ZIP codes
ZIP codes in Michigan
The ZIP codes below are grouped by the Michigan county each mostly falls within (by land area). Each ZIP takes that county's measured median — shown in the group header — so this is a ZIP-to-county guide, not a separate reading for every ZIP. To check the water system serving a specific address, use the lookup.
Key: a † after a ZIP means it has no mapped community water system — usually a private-well area. Plain ZIPs are served by a mapped community water system.
Huron County · 350 mg/L · Very hard
4841348432†48441†48445†48467†48468†48470†48720†48725†48731†48754†48755†48759†
Isabella County · 344.5 mg/L · Very hard
48858†4885948878†48883†48893†48896†49310†
Sanilac County · 340 mg/L · Very hard
48401†48410†4841648419†48422†48426†48427†48434†48450†48453†48454†48456†48465†48466†484694847148472†48475†
Ingham County · 324 mg/L · Very hard
48819†48823488244882548840†48842488544886448892†48895489104891148912489154893349251†49264†49285†
Eaton County · 322 mg/L · Very hard
4881348821†4882748837†48861†48876†48890†4891749021†49076†49096†
Lenawee County · 320 mg/L · Very hard
49220†4922149228†4922949235†49236†49238†49247†49248†49253†49256†49265†49268†49276†49279†4928649287†49289†
Monroe County · 318 mg/L · Very hard
481174813148133†48140†4814448145†48157†48159†481604816148162†4816648177†48179†48182†49267†49270†
Clinton County · 300 mg/L · Very hard
48808†48820†48822†48831†48835†4885348866†48879†4889448906†
Shiawassee County · 295 mg/L · Very hard
48414†48418†4842948449†48460†48476†48817†48841†48848†48857†4886748872†
Ionia County · 290 mg/L · Very hard
48809†48815†48845†4884648849†48851†48860†48865†48870†48873†48875†48881
Lapeer County · 286 mg/L · Very hard
48003†48412†48421†48428†48440†48444†484464845548461†48464†4872748760†
Hillsdale County · 280 mg/L · Very hard
49227†49232†49242†49249†49250†4925249258†49262†49266†49271†49274†49282†49288†
Washtenaw County · 280 mg/L · Very hard
48103†4810448105†48108481094811848130†4815848176†48189†48190†48191†48197†48198†
Livingston County · 277 mg/L · Very hard
4811448116†48137†48139†48143†4816948353†48430†48816†4883648843†48855†
Branch County · 270 mg/L · Very hard
49028†49036†4908249089†49094†49255†
Calhoun County · 270 mg/L · Very hard
49011†49014†4901549017†49029†49033†49037†49051†49068†49092†49224†49245
Oakland County · 270 mg/L · Very hard
480094801748025480304803348034†4806748069480704807148072†480734807548076480834808448085480984816548167†48178482204823748301483024830448306†483074830948320483224832348324†48326483274832848329483314833448335483364834048341483424834648348†48350†48356†48357†48359†48360†4836248363†48367†48370†4837148374483754837748380†48381†4838248383†48386†48390483934844248462†
Macomb County · 265 mg/L · Very hard
48005†48015†4802148026480354803648038480424804348044480454804748048†48050†4805148062†48065†4806648080480814808248088480894809148092480934809448095†48096†48310483124831348314483154831648317†
Berrien County · 260 mg/L · Very hard
49022†49038†49084†4908549098†49101†49102†49103†49104†4910649107†49111†49113†4911549116†49117†49119†4912049125†49126†4912749128†49129†
Jackson County · 260 mg/L · Very hard
49201492024920349230†49233†49234†4923749240†49241†49246†4925449259†4926149263†49269†49272†49277†4928349284
Kalamazoo County · 260 mg/L · Very hard
4900149002†49004†49006†4900749008†49009†49012†4902449034†49048†49052†4905349074†49083†49087†49088†49097†
Ottawa County · 260 mg/L · Very hard
4940149403†494044940949417†4942449426†4942849430†49434†49435†49448†494564946049464†49534
Saginaw County · 259.5 mg/L · Very hard
48415†48417†48601486024860348604486074860948614†4861648623†4862648637†4863848649†4865548722†4872448734†
Allegan County · 250 mg/L · Very hard
4901049070†49078†49080†49323†49328†49335†49344†49348†4940649408†49419†49423†49450†49453
St. Joseph County · 250 mg/L · Very hard
49030†49032†4904049042†49066†4907249075†49091†49093†49099†
Midland County · 248 mg/L · Very hard
48618†48620†48628†486404864248657†
Bay County · 240 mg/L · Very hard
48611†48613†48631†48634†48650†4870648708†48710†4873248747†
Kent County · 230 mg/L · Very hard
49301†49302†4930649315†49316†49319†4932149326†49330†4933149341†49343†49345494184950349504495054950649507495084950949512495194952549544†4954649548
Tuscola County · 230 mg/L · Very hard
48435†48701†48723†4872648729†48733†48735†48741†48744†48746†48757†48767†48768
Cass County · 220 mg/L · Very hard
49031†49047†49061†49067†49095†49112†49130†
Genesee County · 220 mg/L · Very hard
48411†48420†484234843348436†4843748438†4843948451†48457†48458†48463†48473†485024850348504485054850648507†4850948519†4852948532†
Menominee County · 220 mg/L · Very hard
49812†49821†49847†49848†49858†49863†49873†49874†4988649887†49893†49896†
Arenac County · 210 mg/L · Very hard
48658†48659†48703†48749†48765†48766†
Barry County · 200 mg/L · Very hard
48897†49046†49050†4905849060†49073†49325†49333†
Gladwin County · 200 mg/L · Very hard
48610†48612†48624†48652†
Montmorency County · 190 mg/L · Very hard
49709†49746†
Otsego County · 190 mg/L · Very hard
49735†49751†49795†
Oscoda County · 186 mg/L · Very hard
48619†48621†48636†48647†49756†
Alpena County · 180 mg/L · Very hard
4970749744†49753†49766†
Antrim County · 170 mg/L · Hard
49611†49612†4961549622†49627†4962949648†49659†49727†49729†49730†
Emmet County · 170 mg/L · Hard
49701†49706†49716†49718†49722†49740†49755†4976449769†49770†
Montcalm County · 170 mg/L · Hard
48811†48818†48829†48834†4883848850†48852†48884†48885†48886†48888†48891†49322†49329†49339†49347†
Manistee County · 164 mg/L · Hard
49613†49614†49619†49625†49626†4963449645†49660†49675†49689†
Cheboygan County · 160 mg/L · Hard
49705†49717†49721†49749†49791†49799†
Grand Traverse County · 160 mg/L · Hard
49620†49637†49649†49685†49686†49690†49696†
Lake County · 160 mg/L · Hard
49304†49402†49623†49642†49644†49656†
Leelanau County · 160 mg/L · Hard
49621†49630†49636†49653†49654†49664†49670†49674†4968249684†
Mason County · 160 mg/L · Hard
49405†49410†49411†49431†49454†49458†
Muskegon County · 160 mg/L · Hard
49303†49318†49415†49425†49437†494404944149442†4944349444†49445†49451†49457†49461†
Newaygo County · 160 mg/L · Hard
49309†49312†49327†49337†49338†49349†49412
Oceana County · 160 mg/L · Hard
49420†49421†49436†49446†49449†49452†4945549459†
Ogemaw County · 160 mg/L · Hard
48635†48654†48661†48756†48761†
Osceola County · 160 mg/L · Hard
49631†49639†49655†49665†49677†49679†49688†
Benzie County · 150 mg/L · Hard
49616†49617†4962849635†49640†49643†49650†49683†
Charlevoix County · 150 mg/L · Hard
4971249713†49720†49782†49796†
Crawford County · 150 mg/L · Hard
49733†49738†
Iosco County · 150 mg/L · Hard
48730†48739†48743†48748†48750†48763†48770†
Van Buren County · 150 mg/L · Hard
4901349026†49027†49043†49045†49055†49056†49057†49063†4906449065†4907149079†49090†
Wexford County · 150 mg/L · Hard
49601†49618†49638†49663†49668
Presque Isle County · 145 mg/L · Hard
49743†49759†49765†49776†4977749779†
Mecosta County · 140 mg/L · Hard
49305†4930749320†49332†49336†49340†49342†49346†
Missaukee County · 132 mg/L · Hard
49632†49651†49657†49667†
Delta County · 130 mg/L · Hard
49807†49817†49829†49835†49837†49864†49872†49878†4989449895†
Alcona County · 120 mg/L · Hard
48705†48721†48728†48737†48738†48740†48742†48745†48762†49747†
Clare County · 120 mg/L · Hard
48617†48622†48625†48632†48633†
Roscommon County · 120 mg/L · Hard
48627†48629†4863048651†48653†48656†
Wayne County · 110 mg/L · Moderately hard
4810148111†48120481224812448125481264812748128481344813548138481414814648150481524815448164†48168481704817348174†4818048183481844818548186481874818848192481934819548201482024820348204482054820648207†482084820948210482114821248213482144821548216†4821748218†48219†4822148223482244822548226482274822848229†4823048233†48234482354823648238482394824048242†48243†
Kalkaska County · 105 mg/L · Moderately hard
49633†49646†49676†49680†
Mackinac County · 100 mg/L · Moderately hard
49719†49745†49757†49760†49762†49775†49781†49820†49827†49838†
St. Clair County · 100 mg/L · Moderately hard
48001†48002†48006†4801448022†48023†48027†48028†48032†48039†4804048041†48049†48054†48059†4806048063†48064†48074†48079†48097†
Alger County · 93 mg/L · Moderately hard
49806†49816†49822†49825†49826†49839†49862†49884†49891†
Schoolcraft County · 91 mg/L · Moderately hard
49836†49840†49854†49883†
Iron County · 72.5 mg/L · Moderately hard
49902†49903†4991549920†49927†49935†
Luce County · 71.6 mg/L · Moderately hard
49853†49868†
Keweenaw County · 67 mg/L · Moderately hard
49805†4990149918†49950†
Houghton County · 66 mg/L · Moderately hard
49905†4991349916†49917†4992149922†49930†4993149934†49942†49945†49952†49955†49958†49961†49963†49965†49967†
Ontonagon County · 64.8 mg/L · Moderately hard
49910†49912†49925†49929†49948†49953†49960†49971†
Marquette County · 60.5 mg/L · Moderately hard
49808†49814†49818†49833†49841†49849†49855†49866†49871†49879†49880†49885†
Dickinson County · 53 mg/L · Soft
49801†4980249815†49831†49834†49852†49870†49876†49877†49881†49892†
Baraga County · 50 mg/L · Soft
49861†49908†49919†49946†49962†49970†
Chippewa County · 48 mg/L · Soft
49710†49715†49724†49725†49726†49728†49736†49748†4975249768†49774†49780†49783†4978449788†49793†
Gogebic County · 47.1 mg/L · Soft
49911†49938†49947†49959†49968†49969†
† 684 ZIP codes are not served by a mapped community water system — most are private-well areas. See well water hardness.
Source
Groundwater vs surface water
Michigan's groundwater measures harder than its surface water — 284 mg/L across 3,108 samples versus 160 across 17,956, about 1.8× harder. Wells draw from groundwater, so well owners in Michigan tend to see the harder number — 284 mg/L, very hard. Groundwater readings there run 120 to 514 mg/L across the middle 80% of samples. The comparison draws on 2,526 groundwater and 2,339 surface-water monitoring sites; 40 readings above 2,000 mg/L were logged but held out of the medians as outliers.
Groundwater (wells)
284 mg/L as CaCO₃ · 3,108 results at 2,526 stations.
Surface water (rivers, lakes)
160 mg/L as CaCO₃ · 17,956 results at 2,339 stations.
Groundwater measures about 1.8× harder than surface water here.
Chemistry
Water chemistry in Michigan
Beyond the hardness number, Michigan's water carries a fuller chemical signature — here is how its measured parameters compare to national benchmarks.
TDS
250 mg/L · n=3,724
250 mg/L — about 1.1× the national county median of 226, consistent with hard, mineral-rich water.
pH
8 pH · n=12,698
pH 8 — within the EPA secondary range of 6.5–8.5, on the alkaline side.
Alkalinity
124 mg/L as CaCO3 · n=11,396
124 mg/L — substantial buffering capacity, which resists pH swings.
Calcium : Magnesium
41.4 : 11.8 mg/L ≈ 3.51 : 1 · n=7,385
Calcium is about 68% of Michigan's hardness (41.4 mg/L Ca to 11.8 mg/L Mg), a little in line with than the national ~68% calcium share.
Parameter medians may include a small share of quality-control samples; the hardness lane is fully QC-filtered.
Aquifers
Major aquifers under Michigan
3 aquifer systems supply much of Michigan's measured groundwater.
- Silurian-Devonian aquifers — median 326 mg/L across 98 samples at 88 sites: very hard.
- Pennsylvanian aquifers — median 310 mg/L across 432 samples at 357 sites: very hard.
- Sand and gravel aquifers (glaciated regions) — median 292 mg/L across 1,265 samples at 880 sites: very hard.
Together these systems account for 1,795 measured samples at 1,325 sites. Aquifer medians pool samples across a whole system and can mask local variation — see the national aquifer map for how these compare across states.
Trend
Hardness over time
Michigan's decade median moved from 280 mg/L in the 1940s to 170 in the 2020s. Over the series, the decade median peaked at 280 mg/L in the 1940s and bottomed at 130 in the 1970s. Decade medians reflect where and what agencies sampled in each era, not just changes in the water itself.
Scale
Where Michigan sits on the scale
On the USGS scale, Michigan's 168 mg/L is hard — 9.8 grains per gallon, above the 120 mg/L hard cutoff, below very hard.
At 168 mg/L (9.8 gpg), water-softener owners in Michigan typically set their unit to this hardness — settings calculator.
Questions
Frequently asked questions
- Is Michigan's water hard?
- Michigan's median hardness is 168 mg/L as CaCO₃, "hard" on the USGS scale and 1.2× the national county median of 140 mg/L. About 78% of residents in measured counties have hard-or-worse water.
- Which county in Michigan has the hardest water?
- Huron County, with a median of 350 mg/L as CaCO₃ across 181 measurements.
- Is well water harder than city water in Michigan?
- Groundwater measures harder here — about 1.8× the surface water — so wells tend to run harder (groundwater 284 vs surface water 160 mg/L).
- How do I find my exact hardness in Michigan?
- Search your ZIP on the lookup tool, read your utility's Consumer Confidence Report, or test at home with a kit.
- Is Michigan's water harder than the national average?
- Yes. Michigan's median of 168 mg/L is 1.2× the national county median of 140 mg/L, and Michigan ranks #17 of the 50 states and D.C.
Compare
States with similar hardness
Two states measure closest to Michigan's 168 mg/L: Colorado at 157 mg/L and Montana at 183 mg/L. Michigan measures harder than 68% of states. Browse the full ranking on the statistics page.
More: hardness scale · check your address · national statistics · the national map.
By Marko Visic, MPharm, BSc Physics. Source: USGS/EPA Water Quality Portal — 21,097 Michigan measurements. Data last verified . Methodology.
Cite this page: “Michigan Water Hardness by County.” Hard Water Map. Retrieved 2026-07-22, https://hardwatermap.com/water-hardness/michigan/