Montana Water Hardness by County
Water in Montana has a median hardness of 183 mg/L as CaCO₃ — "very hard" on the USGS scale — based on 84,286 measurements at 14,986 monitoring stations. Rosebud County has the state's hardest measured water (820 mg/L); Ravalli County the softest (30.5). Rank: #16 of the 50 states and D.C.
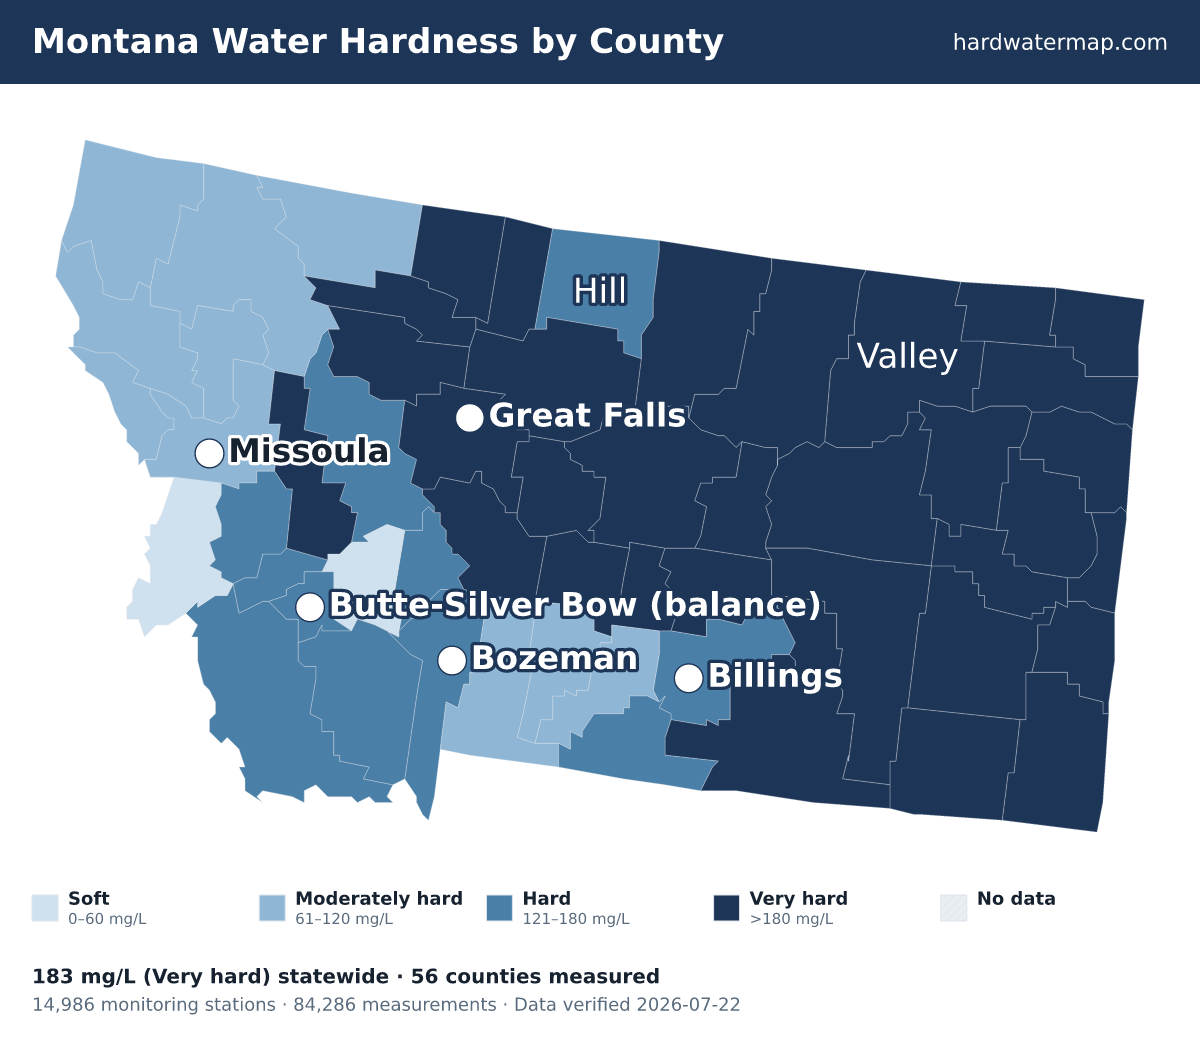
Montana water hardness map — what the numbers mean. Data verified 2026-07-22.
Of Montana's 56 measured counties, 33 very hard, 11 hard, 10 moderately hard, and 2 soft. The hardest are Rosebud County (820 mg/L), Petroleum County (691.5), and Powder River County (579). Ravalli County is the softest at 30.5 mg/L (soft).
About 64% of Montana's roughly 1.1 million residents in counties with gate-passing hardness data live where tap water is hard or worse.
Statewide, Montana's median works out to 10.7 grains per gallon and ranks #16 of the 50 states and D.C. Across 84,286 measurements at 14,986 stations — 38,413 of them since 2000 — the middle 80% of readings fall between 38.5 and 809 mg/L. The public record runs from 1908 to 2026.
See where Montana sits nationally on the national map, or what its number means on the hardness scale.
Download the Montana water hardness map (PNG) — Water hardness by county in Montana: 56 counties mapped from USGS/EPA data, statewide median 183 mg/L (very hard); darker counties have harder water.
By county
Water hardness by county
The table lists all 56 measured Montana counties, hardest first. Their medians span 820 mg/L in Rosebud County to 30.5 in Ravalli County — a 26.9× range.
| County | Median | Band | Results | Sites | Newest |
|---|---|---|---|---|---|
| Rosebud County | 820 | Very hard | 15,683 | 1,680 | 2025 |
| Petroleum County | 691.5 | Very hard | 621 | 106 | 2016 |
| Powder River County | 579 | Very hard | 1,566 | 481 | 2026 |
| Wibaux County | 570 | Very hard | 169 | 66 | 2013 |
| Musselshell County | 540 | Very hard | 673 | 221 | 2026 |
| Toole County | 434 | Very hard | 107 | 74 | 2026 |
| Golden Valley County | 424 | Very hard | 361 | 85 | 2016 |
| Sheridan County | 420 | Very hard | 389 | 233 | 2026 |
| Teton County | 378 | Very hard | 480 | 144 | 2026 |
| Dawson County | 359 | Very hard | 357 | 182 | 2018 |
| Carter County | 351 | Very hard | 197 | 105 | 2017 |
| Custer County | 340 | Very hard | 2,335 | 207 | 2026 |
| Wheatland County | 338 | Very hard | 300 | 61 | 2026 |
| Phillips County | 324 | Very hard | 2,596 | 323 | 2026 |
| Big Horn County | 320 | Very hard | 3,040 | 719 | 2026 |
| Treasure County | 320 | Very hard | 723 | 74 | 2018 |
| Fallon County | 294 | Very hard | 353 | 141 | 2026 |
| Cascade County | 290 | Very hard | 2,486 | 229 | 2026 |
| Daniels County | 290 | Very hard | 588 | 80 | 2026 |
| Fergus County | 280 | Very hard | 657 | 348 | 2026 |
| Blaine County | 278 | Very hard | 1,704 | 242 | 2026 |
| Prairie County | 270 | Very hard | 296 | 86 | 2018 |
| McCone County | 260 | Very hard | 806 | 218 | 2019 |
| Roosevelt County | 244 | Very hard | 895 | 288 | 2023 |
| Liberty County | 240 | Very hard | 316 | 73 | 2013 |
| Richland County | 240 | Very hard | 1,466 | 193 | 2026 |
| Valley County | 240 | Very hard | 1,090 | 234 | 2026 |
| Pondera County | 238 | Very hard | 251 | 91 | 2012 |
| Meagher County | 195 | Very hard | 829 | 165 | 2026 |
| Powell County | 191 | Very hard | 2,227 | 272 | 2026 |
| Chouteau County | 190 | Very hard | 560 | 119 | 2026 |
| Garfield County | 185.5 | Very hard | 169 | 93 | 2026 |
| Judith Basin County | 184 | Very hard | 314 | 172 | 2026 |
| Yellowstone County | 178 | Hard | 1,729 | 317 | 2026 |
| Carbon County | 170 | Hard | 1,625 | 282 | 2026 |
| Silver Bow County | 166 | Hard | 2,446 | 171 | 2025 |
| Deer Lodge County | 154 | Hard | 3,952 | 159 | 2026 |
| Madison County | 153 | Hard | 1,660 | 440 | 2026 |
| Broadwater County | 150 | Hard | 605 | 148 | 2026 |
| Gallatin County | 140 | Hard | 1,734 | 577 | 2026 |
| Hill County | 140 | Hard | 549 | 121 | 2016 |
| Beaverhead County | 134 | Hard | 1,691 | 653 | 2026 |
| Granite County | 130 | Hard | 1,005 | 203 | 2026 |
| Lewis and Clark County | 122 | Hard | 4,523 | 748 | 2026 |
| Missoula County | 112 | Moderately hard | 3,426 | 305 | 2026 |
| Sweet Grass County | 106 | Moderately hard | 299 | 131 | 2026 |
| Lake County | 105 | Moderately hard | 458 | 150 | 2026 |
| Glacier County | 100 | Moderately hard | 1,434 | 326 | 2026 |
| Lincoln County | 99 | Moderately hard | 3,025 | 408 | 2026 |
| Mineral County | 93.2 | Moderately hard | 358 | 52 | 2026 |
| Flathead County | 87.8 | Moderately hard | 1,884 | 403 | 2026 |
| Sanders County | 86.7 | Moderately hard | 1,902 | 224 | 2026 |
| Stillwater County | 78 | Moderately hard | 847 | 163 | 2026 |
| Park County | 72 | Moderately hard | 1,257 | 304 | 2026 |
| Jefferson County | 46 | Soft | 2,738 | 640 | 2026 |
| Ravalli County | 30.5 | Soft | 535 | 256 | 2026 |
ZIP codes
ZIP codes in Montana
The ZIP codes below are grouped by the Montana county each mostly falls within (by land area). Each ZIP takes that county's measured median — shown in the group header — so this is a ZIP-to-county guide, not a separate reading for every ZIP. To check the water system serving a specific address, use the lookup.
Key: a † after a ZIP means it has no mapped community water system — usually a private-well area. Plain ZIPs are served by a mapped community water system.
Rosebud County · 820 mg/L · Very hard
59012†59039†59043†59054†59083†59323†59327†59333†59347†
Petroleum County · 691.5 mg/L · Very hard
59087†
Powder River County · 579 mg/L · Very hard
59003†59062†59314†59316†59317†59343†59351†
Wibaux County · 570 mg/L · Very hard
59353†
Musselshell County · 540 mg/L · Very hard
59059†59072†
Toole County · 434 mg/L · Very hard
59435†59444†59454†59466†59474†59482†59484†
Golden Valley County · 424 mg/L · Very hard
59046†59074†
Sheridan County · 420 mg/L · Very hard
59211†59219†59242†59247†59252†59254†59256†59257†59258†59275†
Teton County · 378 mg/L · Very hard
59419†59422†59433†59436†59467†59468†
Dawson County · 359 mg/L · Very hard
59259†59315†59330†59339†
Carter County · 351 mg/L · Very hard
59311†59319†59324†59332†
Custer County · 340 mg/L · Very hard
59301†59336†59338†59345†
Wheatland County · 338 mg/L · Very hard
59036†59078†59085†59453†
Phillips County · 324 mg/L · Very hard
59261†59524†59537†59538†59544†59546†
Big Horn County · 320 mg/L · Very hard
59016†59022†59025†59031†59034†59035†59050†59064†59066†59075†59089†
Treasure County · 320 mg/L · Very hard
59010†59038†59076†
Fallon County · 294 mg/L · Very hard
59313†59344†59354†
Cascade County · 290 mg/L · Very hard
5940159404†59405†59412†59414†59421†59443†59463†59465†59472†59477†59480†59483†59485†59487†
Daniels County · 290 mg/L · Very hard
59222†59253†59263†59276†
Fergus County · 280 mg/L · Very hard
59032†59424†59430†59441†59451†59457†59464†59471†59489†
Blaine County · 278 mg/L · Very hard
59523†59526†59527†59529†59535†59542†59547†
Prairie County · 270 mg/L · Very hard
59326†59349†
McCone County · 260 mg/L · Very hard
59214†59215†59223†59274†
Roosevelt County · 244 mg/L · Very hard
59201†59212†59213†59218†59226†59255†
Liberty County · 240 mg/L · Very hard
59456†5946159522†59531†59545†
Richland County · 240 mg/L · Very hard
59217†59221†59243†59262†59270†
Valley County · 240 mg/L · Very hard
59225†59230†5923159240†59241†59244†59248†59250†59260†59273†
Pondera County · 238 mg/L · Very hard
594165942559432†59448†59486†
Meagher County · 195 mg/L · Very hard
59053†59642†59645†
Powell County · 191 mg/L · Very hard
59713†59722†59728†59731†59733†59843†59854†
Chouteau County · 190 mg/L · Very hard
59420†59440†59442†59446†59450†59460†59520†
Garfield County · 185.5 mg/L · Very hard
59058†59077†59312†59318†59322†59337†
Judith Basin County · 184 mg/L · Very hard
59418†59447†59452†59462†59469†59479†
Yellowstone County · 178 mg/L · Hard
59002†59006†59015†59024†59037†59044†59079†59088†59101†5910259105†59106†
Carbon County · 170 mg/L · Hard
59007†59008†59013†59014†59026†59029†59041†59068†59070†59071†
Silver Bow County · 166 mg/L · Hard
59701†59727†59748†59750†
Deer Lodge County · 154 mg/L · Hard
59711†59756†59762†
Madison County · 153 mg/L · Hard
59710†5971659720†59729†59735†59740†59745†59747†59749†59751†59754†59755†
Broadwater County · 150 mg/L · Hard
59643†59644†59647†
Gallatin County · 140 mg/L · Hard
59714†59715†59718†59730†59741†59752†59758†59760†
Hill County · 140 mg/L · Hard
59501†59521†59525†59528†59530†59532†59540†
Beaverhead County · 134 mg/L · Hard
59724†59725†59732†59736†59739†59743†59746†59761†
Granite County · 130 mg/L · Hard
59825†59832†59837†59858†
Lewis and Clark County · 122 mg/L · Hard
59410†59601†59602†596235962559633†59635†59636†59639†59640†59648†
Missoula County · 112 mg/L · Moderately hard
5980159802†59803†59804†59808†5981259821†59823†59826†59834†59846†59847†5985159868†
Sweet Grass County · 106 mg/L · Moderately hard
59011†59033†59052†59055†
Lake County · 105 mg/L · Moderately hard
59824†5985559860†59863†59864†59865†59910†59911†59914†59915†59929†59931†
Glacier County · 100 mg/L · Moderately hard
59411†59417†59427†59434†
Lincoln County · 99 mg/L · Moderately hard
59917†59918†59923†59930†59933†59934†59935†
Mineral County · 93.2 mg/L · Moderately hard
59820†59830†59842†59866†59867†59872†
Flathead County · 87.8 mg/L · Moderately hard
59901†59912†59913†59916†5991959920†5992259925†59926†59927†59928†59932†59936†59937†
Sanders County · 86.7 mg/L · Moderately hard
59831†59844†59845†59848†59853†59856†59859†59873†59874†
Stillwater County · 78 mg/L · Moderately hard
59001†5901959028†59057†59061†59063†59067†59069†
Park County · 72 mg/L · Moderately hard
59018†59020†59027†59030†59047†59065†59081†59082†59086†
Jefferson County · 46 mg/L · Soft
59631†59632†59634†59638†59721†59759†
Ravalli County · 30.5 mg/L · Soft
59827†59828†59829†59833†59840†59841†59870†59871†59875†
† 353 ZIP codes are not served by a mapped community water system — most are private-well areas. See well water hardness.
Source
Groundwater vs surface water
Montana's groundwater measures harder than its surface water — 318 mg/L across 22,107 samples versus 170 across 60,789, about 1.9× harder. Wells draw from groundwater, so well owners in Montana tend to see the harder number — 318 mg/L, very hard. Groundwater readings there run 33 to 1580 mg/L across the middle 80% of samples. The comparison draws on 6,950 groundwater and 7,900 surface-water monitoring sites; 9,009 readings above 2,000 mg/L were logged but held out of the medians as outliers.
Groundwater (wells)
318 mg/L as CaCO₃ · 22,107 results at 6,950 stations.
Surface water (rivers, lakes)
170 mg/L as CaCO₃ · 60,789 results at 7,900 stations.
Groundwater measures about 1.9× harder than surface water here.
Chemistry
Water chemistry in Montana
Beyond the hardness number, Montana's water carries a fuller chemical signature — here is how its measured parameters compare to national benchmarks.
TDS
2210 mg/L · n=28,989
2210 mg/L — about 9.8× the national county median of 226, consistent with hard, mineral-rich water.
pH
7.8 pH · n=45,182
pH 7.8 — within the EPA secondary range of 6.5–8.5, on the alkaline side.
Alkalinity
242 mg/L as CaCO3 · n=38,066
242 mg/L — substantial buffering capacity, which resists pH swings.
Calcium : Magnesium
63 : 23 mg/L ≈ 2.74 : 1 · n=48,774
Calcium is about 62% of Montana's hardness (63 mg/L Ca to 23 mg/L Mg), a little more magnesium-rich than the national ~68% calcium share.
Parameter medians may include a small share of quality-control samples; the hardness lane is fully QC-filtered.
Aquifers
Major aquifers under Montana
3 aquifer systems supply much of Montana's measured groundwater.
- Alluvial aquifers — median 356 mg/L across 72 samples at 63 sites: very hard.
- Lower Tertiary aquifers — median 242.5 mg/L across 64 samples at 43 sites: very hard.
- Northern Rocky Mountains Intermontane Basins aquifer systems — median 105.7 mg/L across 30 samples at 26 sites: moderately hard.
Together these systems account for 166 measured samples at 132 sites. Aquifer medians pool samples across a whole system and can mask local variation — see the national aquifer map for how these compare across states.
Trend
Hardness over time
Montana's decade median moved from 280 mg/L in the 1910s to 177 in the 2020s. Over the series, the decade median peaked at 390 mg/L in the 1950s and bottomed at 132 in the 2000s. Decade medians reflect where and what agencies sampled in each era, not just changes in the water itself.
Scale
Where Montana sits on the scale
On the USGS scale, Montana's 183 mg/L is very hard — 10.7 grains per gallon, well above the 180 mg/L very-hard cutoff — among the hardest water measured in the US.
At 183 mg/L (10.7 gpg), water-softener owners in Montana typically set their unit to this hardness — settings calculator.
Questions
Frequently asked questions
- Is Montana's water hard?
- Montana's median hardness is 183 mg/L as CaCO₃, "very hard" on the USGS scale and 1.31× the national county median of 140 mg/L. About 64% of residents in measured counties have hard-or-worse water.
- Which county in Montana has the hardest water?
- Rosebud County, with a median of 820 mg/L as CaCO₃ across 15,683 measurements.
- Is well water harder than city water in Montana?
- Groundwater measures harder here — about 1.9× the surface water — so wells tend to run harder (groundwater 318 vs surface water 170 mg/L).
- How do I find my exact hardness in Montana?
- Search your ZIP on the lookup tool, read your utility's Consumer Confidence Report, or test at home with a kit.
- Is Montana's water harder than the national average?
- Yes. Montana's median of 183 mg/L is 1.31× the national county median of 140 mg/L, and Montana ranks #16 of the 50 states and D.C.
Compare
States with similar hardness
Two states measure closest to Montana's 183 mg/L: Missouri at 196 mg/L and Michigan at 168 mg/L. Montana measures harder than 70% of states. Browse the full ranking on the statistics page.
More: hardness scale · check your address · national statistics · the national map.
By Marko Visic, MPharm, BSc Physics. Source: USGS/EPA Water Quality Portal — 84,286 Montana measurements. Data last verified . Methodology.
Cite this page: “Montana Water Hardness by County.” Hard Water Map. Retrieved 2026-07-22, https://hardwatermap.com/water-hardness/montana/