Utah Water Hardness by County
Water in Utah has a median hardness of 270 mg/L as CaCO₃ — "very hard" on the USGS scale — based on 138,737 measurements at 13,140 monitoring stations. Emery County has the state's hardest measured water (660 mg/L); Wasatch County the softest (166.1). Rank: #8 of the 50 states and D.C.
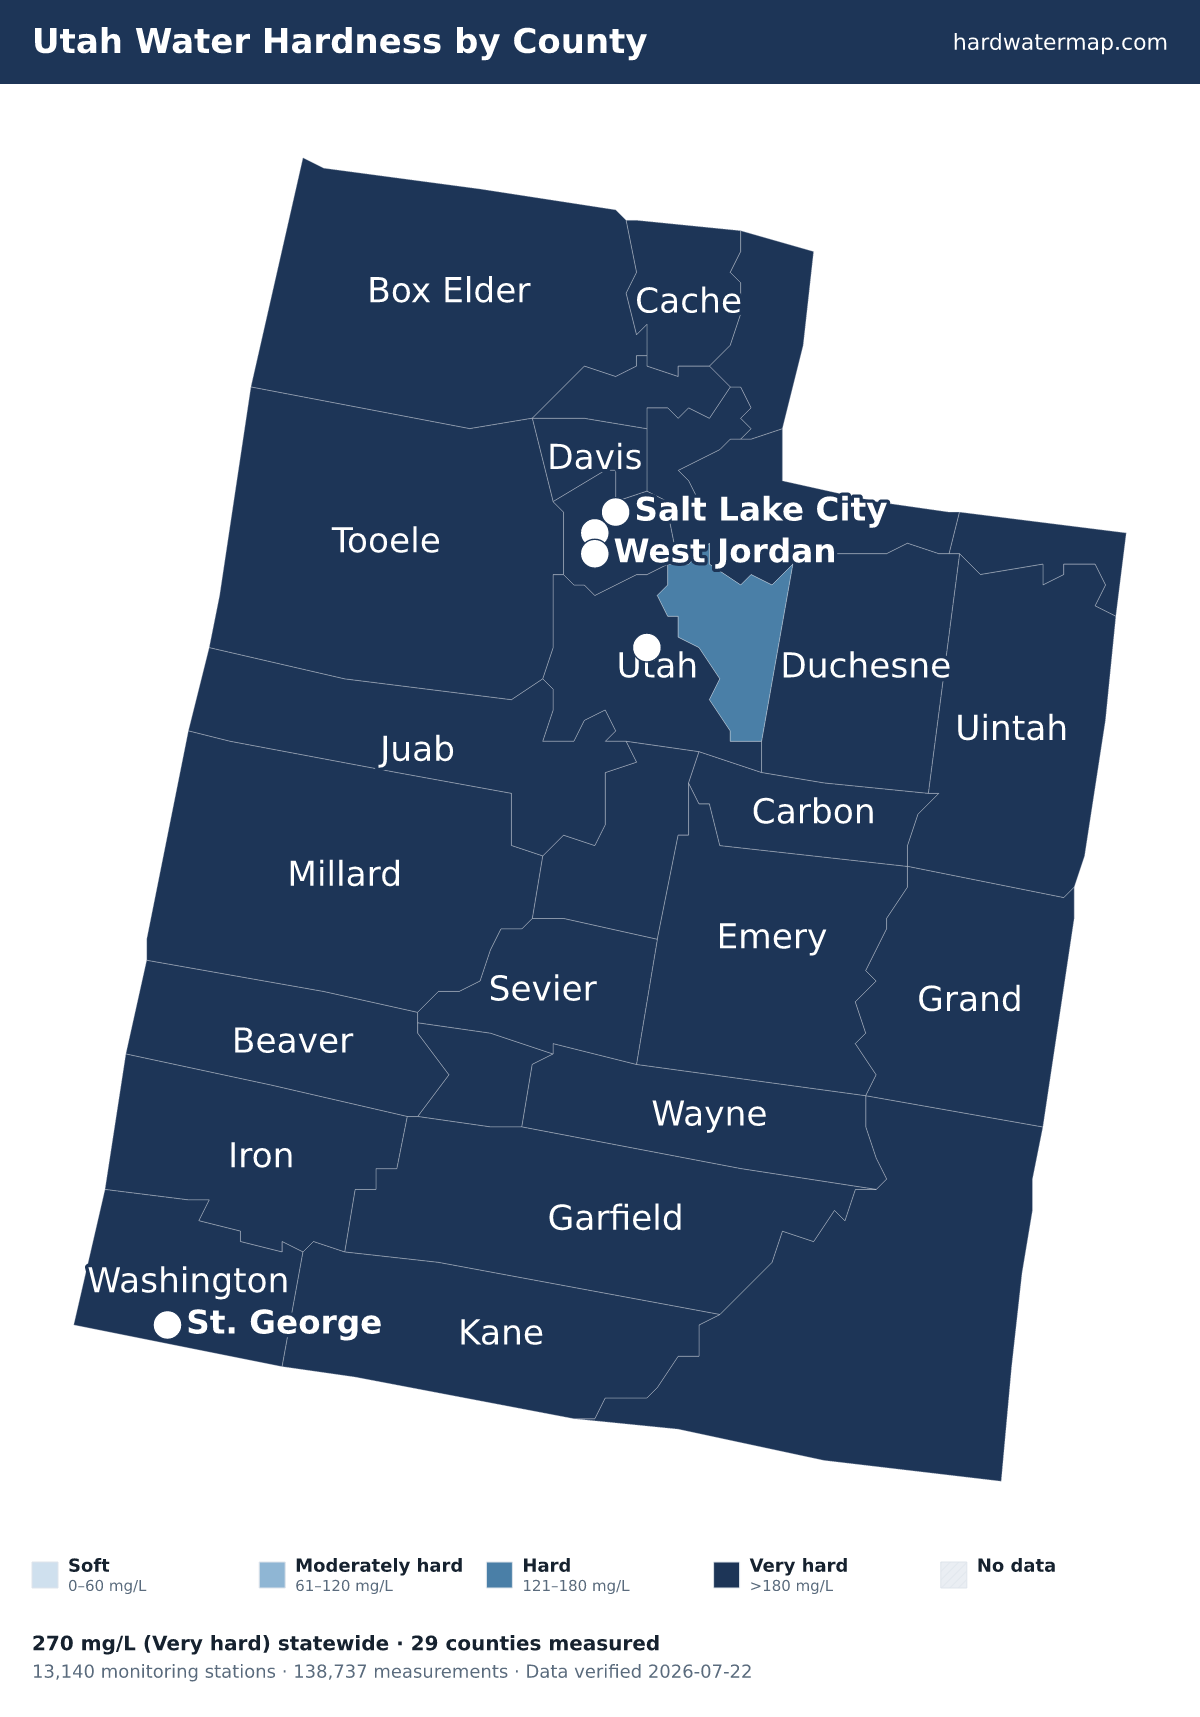
Utah water hardness map — what the numbers mean. Data verified 2026-07-22.
Every one of Utah's 29 measured counties tests hard or harder: 28 rank very hard and 1 rank hard. The hardest are Emery County (660 mg/L), Millard County (450), and Grand County (380). Even Wasatch County, the softest measured area in the state, reads 166.1 mg/L — still hard on the USGS scale.
About 100% of Utah's roughly 3.3 million residents in counties with gate-passing hardness data live where tap water is hard or worse.
Statewide, Utah's median works out to 15.8 grains per gallon and ranks #8 of the 50 states and D.C. Across 138,737 measurements at 13,140 stations — 49,867 of them since 2000 — the middle 80% of readings fall between 102.7 and 733.5 mg/L. The public record runs from 1900 to 2023.
See where Utah sits nationally on the national map, or what its number means on the hardness scale.
Download the Utah water hardness map (PNG) — Water hardness by county in Utah: 29 counties mapped from USGS/EPA data, statewide median 270 mg/L (very hard); darker counties have harder water.
By county
Water hardness by county
The table lists all 29 measured Utah counties, hardest first. Their medians span 660 mg/L in Emery County to 166.1 in Wasatch County — a 4× range.
| County | Median | Band | Results | Sites | Newest |
|---|---|---|---|---|---|
| Emery County | 660 | Very hard | 10,425 | 781 | 2023 |
| Millard County | 450 | Very hard | 2,789 | 452 | 2021 |
| Grand County | 380 | Very hard | 6,973 | 437 | 2023 |
| Juab County | 375.9 | Very hard | 2,276 | 352 | 2021 |
| Sanpete County | 369.2 | Very hard | 2,454 | 265 | 2021 |
| Kane County | 343.7 | Very hard | 4,100 | 373 | 2021 |
| Salt Lake County | 341.7 | Very hard | 11,954 | 1,153 | 2023 |
| Wayne County | 330.4 | Very hard | 2,401 | 277 | 2021 |
| Box Elder County | 318.2 | Very hard | 5,845 | 496 | 2023 |
| Uintah County | 310 | Very hard | 10,975 | 907 | 2023 |
| San Juan County | 290 | Very hard | 7,786 | 819 | 2023 |
| Davis County | 289.1 | Very hard | 4,757 | 261 | 2023 |
| Carbon County | 285 | Very hard | 3,189 | 400 | 2015 |
| Washington County | 283.4 | Very hard | 3,727 | 391 | 2023 |
| Tooele County | 283.1 | Very hard | 2,202 | 787 | 2021 |
| Utah County | 263.5 | Very hard | 9,776 | 850 | 2021 |
| Daggett County | 250 | Very hard | 1,889 | 87 | 2023 |
| Morgan County | 240 | Very hard | 1,859 | 190 | 2015 |
| Rich County | 240 | Very hard | 837 | 55 | 2015 |
| Cache County | 235 | Very hard | 5,267 | 312 | 2021 |
| Iron County | 233.5 | Very hard | 1,664 | 367 | 2021 |
| Duchesne County | 220 | Very hard | 5,706 | 522 | 2023 |
| Sevier County | 198.9 | Very hard | 2,947 | 335 | 2021 |
| Garfield County | 198.1 | Very hard | 5,021 | 473 | 2021 |
| Piute County | 192 | Very hard | 1,537 | 110 | 2021 |
| Weber County | 190.6 | Very hard | 2,297 | 271 | 2023 |
| Beaver County | 190 | Very hard | 2,592 | 540 | 2021 |
| Summit County | 188 | Very hard | 6,430 | 469 | 2015 |
| Wasatch County | 166.1 | Hard | 9,062 | 408 | 2023 |
ZIP codes
ZIP codes in Utah
The ZIP codes below are grouped by the Utah county each mostly falls within (by land area). Each ZIP takes that county's measured median — shown in the group header — so this is a ZIP-to-county guide, not a separate reading for every ZIP. To check the water system serving a specific address, use the lookup.
Key: a † after a ZIP means it has no mapped community water system — usually a private-well area. Plain ZIPs are served by a mapped community water system.
Emery County · 660 mg/L · Very hard
84513†84516†84518†84521†84522†84523†84525†84528†84537†
Millard County · 450 mg/L · Very hard
84624†84631†84635†84636†84637†84638†84640†84644†84649†8465684728†
Grand County · 380 mg/L · Very hard
84515†84532†84540†
Juab County · 375.9 mg/L · Very hard
84628†84639†84645†84648†
Sanpete County · 369.2 mg/L · Very hard
8462184622†84623†8462784629†84630†84632†84634†84642†84643†84646†84647†84662†84665†84667†
Kane County · 343.7 mg/L · Very hard
84710†84729†84741†84755†84758†84762†
Salt Lake County · 341.7 mg/L · Very hard
84006†840098402084044†84047840658407084081840848408884092†84093840948409584096841018410284103841048410584106841078410884109†841118411284113841148411584116†8411784118841198412084121†84123841248412884129841388415084180
Wayne County · 330.4 mg/L · Very hard
84715†84734†8474784749†84773†84775†
Box Elder County · 318.2 mg/L · Very hard
843018430284306†84307†84309843118431284313†84314843168432484329†84330†84331†8433484336†84337†84340†
Uintah County · 310 mg/L · Very hard
84008†84026†84035†8403984063840768407884085†
San Juan County · 290 mg/L · Very hard
84511†84512†84530†84531†84533†84534†84535†84536†
Davis County · 289.1 mg/L · Very hard
8401084014†84015840258403784040†84041840548405684075†84087
Carbon County · 285 mg/L · Very hard
8450184520†84526†84529†84539†84542†
Washington County · 283.4 mg/L · Very hard
84722†84725†84733†84737†84738†84745847468475784763†84765†84767847708477484779†8478084781†84782†84783†8478484790
Tooele County · 283.1 mg/L · Very hard
84022†84029†84034†84069†84071†8407484080†84083†
Utah County · 263.5 mg/L · Very hard
84003†84004†84005840138404284043†84045†84057840588405984062†84097846018460284604†8460684626†84633†84651†8465384655†84660†84663†84664
Daggett County · 250 mg/L · Very hard
84023†84046†
Morgan County · 240 mg/L · Very hard
84018†84050†
Rich County · 240 mg/L · Very hard
84028†84038†84064†84086†
Cache County · 235 mg/L · Very hard
84304†84305†843088431884319†8432084321†8432284325†84326†8432784328†8433284333†84335†843388433984341
Iron County · 233.5 mg/L · Very hard
84714†84719†84720†8472184742†84753†84756†84760†84761†84772†
Duchesne County · 220 mg/L · Very hard
84001840028400784021†84027†84031†8405184052840538406684072†84073
Sevier County · 198.9 mg/L · Very hard
8462084652†84654†84657†84701†847118472484730†84739†84744†8475484766†
Garfield County · 198.1 mg/L · Very hard
8471684718†847268473584736†84759†84764†84776
Piute County · 192 mg/L · Very hard
84712†8472384732†84740†8474384750†
Weber County · 190.6 mg/L · Very hard
84067843108431584317†8440184403†8440484405†8440884414
Beaver County · 190 mg/L · Very hard
84713†84731†84751†84752†
Summit County · 188 mg/L · Very hard
82930†84017†84024†84033†84036†84055†8406084061†84098
Wasatch County · 166.1 mg/L · Hard
84032†84049†84082†
† 178 ZIP codes are not served by a mapped community water system — most are private-well areas. See well water hardness.
Source
Groundwater vs surface water
Utah's groundwater measures harder than its surface water — 296.2 mg/L across 14,011 samples versus 266 across 120,849, about 1.1× harder. Wells draw from groundwater, so well owners in Utah tend to see the harder number — 296.2 mg/L, very hard. Groundwater readings there run 106 to 890 mg/L across the middle 80% of samples. The comparison draws on 5,584 groundwater and 7,141 surface-water monitoring sites; 3,835 readings above 2,000 mg/L were logged but held out of the medians as outliers.
Groundwater (wells)
296.2 mg/L as CaCO₃ · 14,011 results at 5,584 stations.
Surface water (rivers, lakes)
266 mg/L as CaCO₃ · 120,849 results at 7,141 stations.
Groundwater measures about 1.1× harder than surface water here.
Chemistry
Water chemistry in Utah
Beyond the hardness number, Utah's water carries a fuller chemical signature — here is how its measured parameters compare to national benchmarks.
TDS
386 mg/L · n=46,102
386 mg/L — about 1.7× the national county median of 226, consistent with hard, mineral-rich water.
pH
8.2 pH · n=89,455
pH 8.2 — within the EPA secondary range of 6.5–8.5, on the alkaline side.
Alkalinity
184 mg/L as CaCO3 · n=35,729
184 mg/L — substantial buffering capacity, which resists pH swings.
Calcium : Magnesium
60.3 : 24.2 mg/L ≈ 2.49 : 1 · n=67,058
Calcium is about 60% of Utah's hardness (60.3 mg/L Ca to 24.2 mg/L Mg), a little more magnesium-rich than the national ~68% calcium share.
Parameter medians may include a small share of quality-control samples; the hardness lane is fully QC-filtered.
Aquifers
Major aquifers under Utah
3 aquifer systems supply much of Utah's measured groundwater.
- Alluvial aquifers — median 434 mg/L across 92 samples at 28 sites: very hard.
- Basin and Range carbonate-rock aquifers — median 381 mg/L across 61 samples at 28 sites: very hard.
- Basin and Range basin-fill aquifers — median 333.5 mg/L across 749 samples at 266 sites: very hard.
Together these systems account for 902 measured samples at 322 sites. Aquifer medians pool samples across a whole system and can mask local variation — see the national aquifer map for how these compare across states.
Trend
Hardness over time
Utah's decade median moved from 320 mg/L in the 1920s to 342 in the 2020s. Over the series, the decade median peaked at 396 mg/L in the 1950s and bottomed at 244 in the 1990s. Decade medians reflect where and what agencies sampled in each era, not just changes in the water itself.
Scale
Where Utah sits on the scale
On the USGS scale, Utah's 270 mg/L is very hard — 15.8 grains per gallon, well above the 180 mg/L very-hard cutoff — among the hardest water measured in the US.
At 270 mg/L (15.8 gpg), water-softener owners in Utah typically set their unit to this hardness — settings calculator.
Questions
Frequently asked questions
- Is Utah's water hard?
- Utah's median hardness is 270 mg/L as CaCO₃, "very hard" on the USGS scale and 1.93× the national county median of 140 mg/L. About 100% of residents in measured counties have hard-or-worse water.
- Which county in Utah has the hardest water?
- Emery County, with a median of 660 mg/L as CaCO₃ across 10,425 measurements. Even the softest, Wasatch County at 166.1 mg/L, is still "hard" on the USGS scale.
- Is well water harder than city water in Utah?
- Groundwater measures harder here — about 1.1× the surface water — so wells tend to run harder (groundwater 296.2 vs surface water 266 mg/L).
- How do I find my exact hardness in Utah?
- Search your ZIP on the lookup tool, read your utility's Consumer Confidence Report, or test at home with a kit.
- Is Utah's water harder than the national average?
- Yes. Utah's median of 270 mg/L is 1.93× the national county median of 140 mg/L, and Utah ranks #8 of the 50 states and D.C.
Compare
States with similar hardness
Two states measure closest to Utah's 270 mg/L: Ohio at 270 mg/L and Indiana at 280 mg/L. Utah measures harder than 86% of states. Browse the full ranking on the statistics page.
More: hardness scale · check your address · national statistics · the national map.
By Marko Visic, MPharm, BSc Physics. Source: USGS/EPA Water Quality Portal — 138,737 Utah measurements. Data last verified . Methodology.
Cite this page: “Utah Water Hardness by County.” Hard Water Map. Retrieved 2026-07-22, https://hardwatermap.com/water-hardness/utah/