South Dakota Water Hardness by County
Water in South Dakota has a median hardness of 391.4 mg/L as CaCO₃ — "very hard" on the USGS scale — based on 54,706 measurements at 23,553 monitoring stations. Brule County has the state's hardest measured water (1300 mg/L); Harding County the softest (94.4). Rank: #1 of the 50 states and D.C.
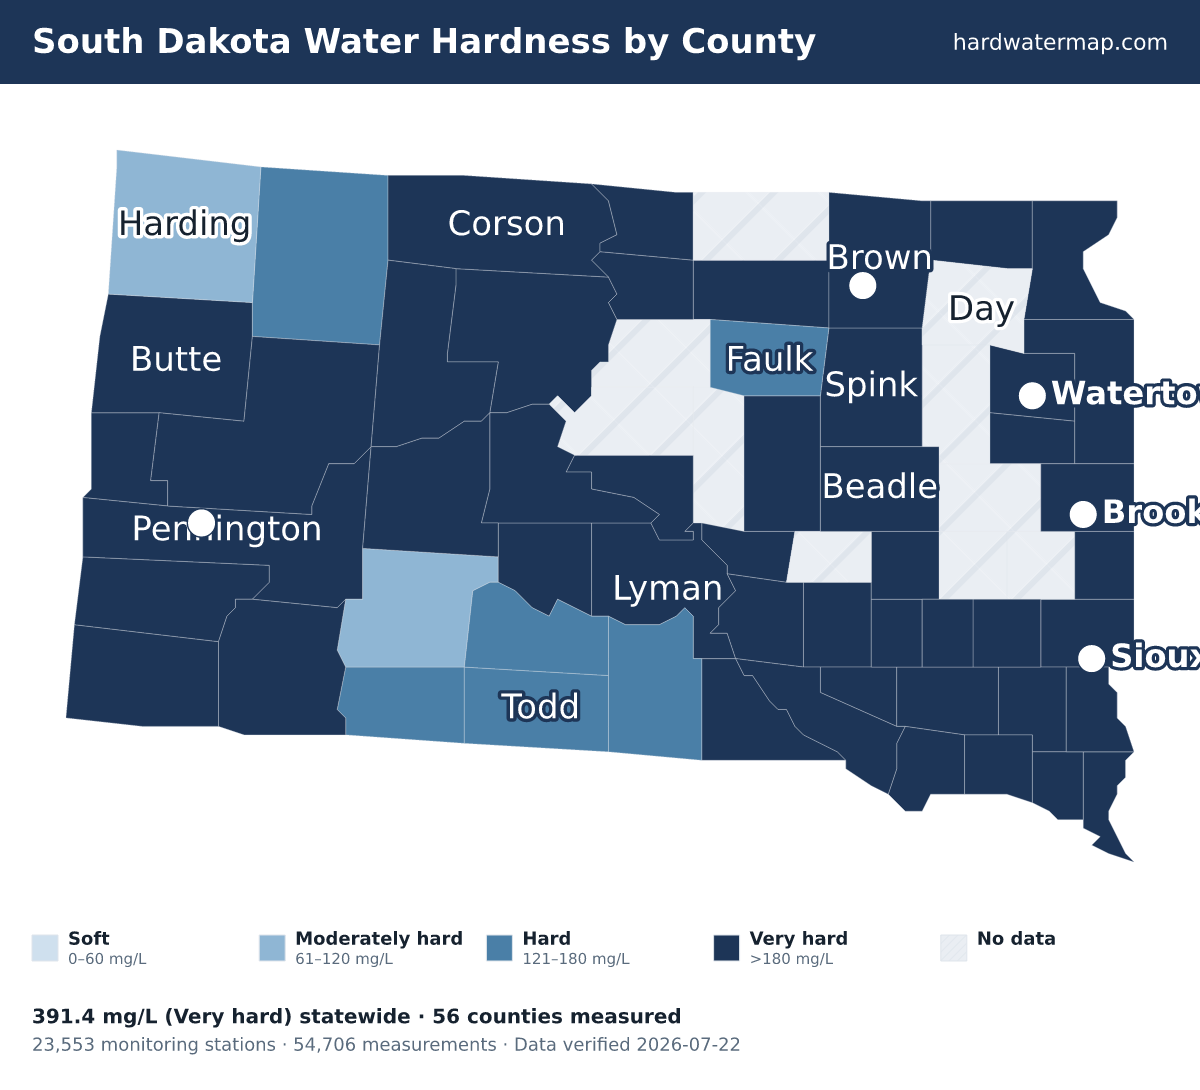
South Dakota water hardness map — what the numbers mean. Data verified 2026-07-22.
Of South Dakota's 56 measured counties, 48 very hard, 6 hard, and 2 moderately hard. The hardest are Brule County (1300 mg/L), Meade County (820), and Clay County (808.5). Harding County is the softest at 94.4 mg/L (moderately hard).
About 100% of South Dakota's roughly 0.9 million residents in counties with gate-passing hardness data live where tap water is hard or worse.
Statewide, South Dakota's median works out to 22.9 grains per gallon and ranks #1 of the 50 states and D.C. Across 54,706 measurements at 23,553 stations — 6,397 of them since 2000 — the middle 80% of readings fall between 116 and 1100 mg/L. The public record runs from 1900 to 2023.
See where South Dakota sits nationally on the national map, or what its number means on the hardness scale.
Download the South Dakota water hardness map (PNG) — Water hardness by county in South Dakota: 56 counties mapped from USGS/EPA data, statewide median 391.4 mg/L (very hard); darker counties have harder water.
By county
Water hardness by county
The table lists all 56 measured South Dakota counties, hardest first. Their medians span 1300 mg/L in Brule County to 94.4 in Harding County — a 13.8× range. 10 more South Dakota counties lack gate-passing data.
| County | Median | Band | Results | Sites | Newest |
|---|---|---|---|---|---|
| Brule County | 1300 | Very hard | 65 | 42 | 2007 |
| Meade County | 820 | Very hard | 1,507 | 370 | 2021 |
| Clay County | 808.5 | Very hard | 1,303 | 816 | 2014 |
| Fall River County | 770 | Very hard | 855 | 301 | 2018 |
| Turner County | 753 | Very hard | 1,045 | 710 | 2014 |
| Ziebach County | 745 | Very hard | 449 | 73 | 2014 |
| McCook County | 700 | Very hard | 106 | 22 | 2014 |
| Butte County | 697 | Very hard | 1,871 | 183 | 2023 |
| Hutchinson County | 690 | Very hard | 1,152 | 562 | 2014 |
| Haakon County | 640 | Very hard | 427 | 48 | 2020 |
| Charles Mix County | 617 | Very hard | 1,459 | 318 | 2022 |
| Buffalo County | 612 | Very hard | 177 | 85 | 2014 |
| Bon Homme County | 590 | Very hard | 338 | 194 | 2005 |
| Roberts County | 580 | Very hard | 1,269 | 959 | 2022 |
| Hanson County | 560 | Very hard | 423 | 223 | 2014 |
| Grant County | 510 | Very hard | 782 | 540 | 2014 |
| Moody County | 510 | Very hard | 1,077 | 462 | 2021 |
| Lincoln County | 500 | Very hard | 388 | 264 | 2004 |
| Marshall County | 500 | Very hard | 518 | 387 | 2014 |
| Union County | 490 | Very hard | 893 | 569 | 2014 |
| Stanley County | 482 | Very hard | 170 | 56 | 2014 |
| Campbell County | 480 | Very hard | 711 | 493 | 2019 |
| Brookings County | 460 | Very hard | 1,412 | 843 | 2014 |
| Deuel County | 460 | Very hard | 274 | 183 | 2013 |
| Hamlin County | 460 | Very hard | 474 | 287 | 2014 |
| Minnehaha County | 432 | Very hard | 2,487 | 597 | 2014 |
| Hand County | 430 | Very hard | 277 | 211 | 2001 |
| Walworth County | 430 | Very hard | 321 | 264 | 2016 |
| Codington County | 423.2 | Very hard | 1,150 | 656 | 2014 |
| Davison County | 410 | Very hard | 485 | 299 | 2014 |
| Spink County | 390 | Very hard | 1,788 | 1,182 | 2014 |
| Sanborn County | 360 | Very hard | 570 | 514 | 2004 |
| Brown County | 343.5 | Very hard | 1,866 | 492 | 2014 |
| Beadle County | 320 | Very hard | 4,275 | 2,221 | 2014 |
| Edmunds County | 310 | Very hard | 126 | 81 | 2001 |
| Dewey County | 281 | Very hard | 379 | 88 | 2014 |
| Lawrence County | 273 | Very hard | 2,189 | 276 | 2023 |
| Gregory County | 260 | Very hard | 190 | 77 | 2014 |
| Hughes County | 260 | Very hard | 822 | 390 | 2020 |
| Pennington County | 250 | Very hard | 2,939 | 516 | 2023 |
| Douglas County | 245 | Very hard | 190 | 142 | 2002 |
| Yankton County | 240 | Very hard | 4,403 | 469 | 2019 |
| Custer County | 230 | Very hard | 1,234 | 352 | 2021 |
| Lyman County | 226.5 | Very hard | 704 | 156 | 2020 |
| Corson County | 218.2 | Very hard | 560 | 107 | 2018 |
| Jones County | 206 | Very hard | 119 | 31 | 2014 |
| Aurora County | 200 | Very hard | 480 | 430 | 2004 |
| Oglala Lakota County | 200 | Very hard | 483 | 109 | 2010 |
| Tripp County | 173 | Hard | 257 | 107 | 2014 |
| Faulk County | 150 | Hard | 112 | 62 | 2001 |
| Todd County | 140.5 | Hard | 379 | 278 | 2016 |
| Mellette County | 140 | Hard | 494 | 106 | 2014 |
| Perkins County | 140 | Hard | 953 | 321 | 2010 |
| Bennett County | 137 | Hard | 204 | 137 | 1995 |
| Jackson County | 97 | Moderately hard | 364 | 75 | 2010 |
| Harding County | 94.4 | Moderately hard | 808 | 571 | 2012 |
ZIP codes
ZIP codes in South Dakota
The ZIP codes below are grouped by the South Dakota county each mostly falls within (by land area). Each ZIP takes that county's measured median — shown in the group header — so this is a ZIP-to-county guide, not a separate reading for every ZIP. To check the water system serving a specific address, use the lookup.
Key: a † after a ZIP means it has no mapped community water system — usually a private-well area. Plain ZIPs are served by a mapped community water system.
Brule County · 1300 mg/L · Very hard
57325†5735557370
Meade County · 820 mg/L · Very hard
57706†57718†57719†57737†57741†57748†57758†57761†57767†57769†5778557787†57791†57792†
Clay County · 808.5 mg/L · Very hard
570105706957073
Fall River County · 770 mg/L · Very hard
5773557747577635776657782
Turner County · 753 mg/L · Very hard
57014570155702157036570435705357070
Ziebach County · 745 mg/L · Very hard
5762257623
McCook County · 700 mg/L · Very hard
570125704757048570585731957374†
Butte County · 697 mg/L · Very hard
57717†57760†5776257788†
Hutchinson County · 690 mg/L · Very hard
57029570455705257331573545736657376
Haakon County · 640 mg/L · Very hard
575525755357567
Charles Mix County · 617 mg/L · Very hard
57329573425735657361573675736957380
Buffalo County · 612 mg/L · Very hard
5733957341
Bon Homme County · 590 mg/L · Very hard
5705957062570635706657315
Roberts County · 580 mg/L · Very hard
56219†57224572275725557257572605726257279
Hanson County · 560 mg/L · Very hard
573115733257340
Grant County · 510 mg/L · Very hard
572165724657251†5725257256†57259572645726557266†57269
Moody County · 510 mg/L · Very hard
57017570245702857065
Lincoln County · 500 mg/L · Very hard
570045701357027570325703457039570645707757108
Marshall County · 500 mg/L · Very hard
572325724757270574215743057454
Union County · 490 mg/L · Very hard
57001570255703857049
Stanley County · 482 mg/L · Very hard
5753257537
Campbell County · 480 mg/L · Very hard
5763257646
Brookings County · 460 mg/L · Very hard
57002570065700757026570615707157220†57276
Deuel County · 460 mg/L · Very hard
57213572185722657234†572375723857268
Hamlin County · 460 mg/L · Very hard
5722157223572415724257248
Minnehaha County · 432 mg/L · Very hard
57003570055701857020570225703057033570355704157055570685710357104571055710657107571105711757197
Hand County · 430 mg/L · Very hard
573625737157373573815746757470
Walworth County · 430 mg/L · Very hard
57420574525747257631
Codington County · 423.2 mg/L · Very hard
572015723557243572455726357272
Davison County · 410 mg/L · Very hard
573015733457363
Spink County · 390 mg/L · Very hard
57424574295743457436574405746157465574695747657477
Sanborn County · 360 mg/L · Very hard
573145735957385
Brown County · 343.5 mg/L · Very hard
5740157426574275743257433574395744157445†574465744957460574745747957481
Beadle County · 320 mg/L · Very hard
5731257322†573245734857350573795738457386
Edmunds County · 310 mg/L · Very hard
574285745157471
Dewey County · 281 mg/L · Very hard
57601576255763057636576525765657661
Lawrence County · 273 mg/L · Very hard
57732†57754†57759†57779†57783†57793†57799†
Gregory County · 260 mg/L · Very hard
573175733557523575335753857571
Hughes County · 260 mg/L · Very hard
575015752257536
Pennington County · 250 mg/L · Very hard
57701†57702†57703†5772557745†577515777557780†57790
Douglas County · 245 mg/L · Very hard
5731357328573305734457364
Yankton County · 240 mg/L · Very hard
57031570375704057046570675707257078
Custer County · 230 mg/L · Very hard
57730577385774457773
Lyman County · 226.5 mg/L · Very hard
573655754457548575685756957576
Corson County · 218.2 mg/L · Very hard
57621†5763357634†57639†57641†57642†57645†57657†57658†57659†57660†
Jones County · 206 mg/L · Very hard
575315755957562
Aurora County · 200 mg/L · Very hard
573685737557383
Oglala Lakota County · 200 mg/L · Very hard
57716†57722†57752†57756†57764†57770†57772†57794†
Tripp County · 173 mg/L · Hard
575285752957534575415758057584
Faulk County · 150 mg/L · Hard
57435574385746657473
Todd County · 140.5 mg/L · Hard
5755557563575665757057572
Mellette County · 140 mg/L · Hard
57521575605757957585
Perkins County · 140 mg/L · Hard
5762057626†57638576405764457649
Bennett County · 137 mg/L · Hard
57551†57574†57714†
Jackson County · 97 mg/L · Moderately hard
57543†57547†57577†57750†
Harding County · 94.4 mg/L · Moderately hard
57650†57651†57720†57724†57755†57776†
† 70 ZIP codes are not served by a mapped community water system — most are private-well areas. See well water hardness.
Source
Groundwater vs surface water
South Dakota's groundwater measures harder than its surface water — 460 mg/L across 28,533 samples versus 339.8 across 25,949, about 1.4× harder. Wells draw from groundwater, so well owners in South Dakota tend to see the harder number — 460 mg/L, very hard. Groundwater readings there run 69 to 1200 mg/L across the middle 80% of samples. The comparison draws on 22,413 groundwater and 1,089 surface-water monitoring sites; 1,070 readings above 2,000 mg/L were logged but held out of the medians as outliers.
Groundwater (wells)
460 mg/L as CaCO₃ · 28,533 results at 22,413 stations.
Surface water (rivers, lakes)
339.8 mg/L as CaCO₃ · 25,949 results at 1,089 stations.
Groundwater measures about 1.4× harder than surface water here.
Chemistry
Water chemistry in South Dakota
Beyond the hardness number, South Dakota's water carries a fuller chemical signature — here is how its measured parameters compare to national benchmarks.
TDS
764 mg/L · n=14,597
764 mg/L — about 3.4× the national county median of 226, consistent with hard, mineral-rich water.
pH
8.3 pH · n=10,495
pH 8.3 — within the EPA secondary range of 6.5–8.5, on the alkaline side.
Alkalinity
200 mg/L as CaCO3 · n=14,926
200 mg/L — substantial buffering capacity, which resists pH swings.
Calcium : Magnesium
82 : 38.7 mg/L ≈ 2.12 : 1 · n=14,541
Calcium is about 56% of South Dakota's hardness (82 mg/L Ca to 38.7 mg/L Mg), a little more magnesium-rich than the national ~68% calcium share.
Parameter medians may include a small share of quality-control samples; the hardness lane is fully QC-filtered.
Aquifers
Major aquifers under South Dakota
3 aquifer systems supply much of South Dakota's measured groundwater.
- Alluvial aquifers — median 555 mg/L across 29 samples at 18 sites: very hard.
- Sand and gravel aquifers (glaciated regions) — median 500 mg/L across 9,254 samples at 6,479 sites: very hard.
- Paleozoic aquifers — median 290 mg/L across 1,008 samples at 568 sites: very hard.
Together these systems account for 10,291 measured samples at 7,065 sites. Aquifer medians pool samples across a whole system and can mask local variation — see the national aquifer map for how these compare across states.
Trend
Hardness over time
South Dakota's decade median moved from 346.5 mg/L in the 1930s to 565 in the 2020s. Over the series, the decade median peaked at 610 mg/L in the 1940s and bottomed at 244 in the 1990s. Decade medians reflect where and what agencies sampled in each era, not just changes in the water itself.
Scale
Where South Dakota sits on the scale
On the USGS scale, South Dakota's 391.4 mg/L is very hard — 22.9 grains per gallon, well above the 180 mg/L very-hard cutoff — among the hardest water measured in the US.
At 391.4 mg/L (22.9 gpg), water-softener owners in South Dakota typically set their unit to this hardness — settings calculator.
Questions
Frequently asked questions
- Is South Dakota's water hard?
- South Dakota's median hardness is 391.4 mg/L as CaCO₃, "very hard" on the USGS scale and 2.8× the national county median of 140 mg/L. About 100% of residents in measured counties have hard-or-worse water.
- Which county in South Dakota has the hardest water?
- Brule County, with a median of 1300 mg/L as CaCO₃ across 65 measurements. Even the softest, Harding County at 94.4 mg/L, is still "moderately hard" on the USGS scale.
- Is well water harder than city water in South Dakota?
- Groundwater measures harder here — about 1.4× the surface water — so wells tend to run harder (groundwater 460 vs surface water 339.8 mg/L).
- How do I find my exact hardness in South Dakota?
- Search your ZIP on the lookup tool, read your utility's Consumer Confidence Report, or test at home with a kit.
- Is South Dakota's water harder than the national average?
- Yes. South Dakota's median of 391.4 mg/L is 2.8× the national county median of 140 mg/L, and South Dakota ranks #1 of the 50 states and D.C.
Compare
States with similar hardness
Two states measure closest to South Dakota's 391.4 mg/L: Iowa at 310 mg/L and North Dakota at 310 mg/L. South Dakota measures harder than 100% of states. Browse the full ranking on the statistics page.
More: hardness scale · check your address · national statistics · the national map.
By Marko Visic, MPharm, BSc Physics. Source: USGS/EPA Water Quality Portal — 54,706 South Dakota measurements. Data last verified . Methodology.
Cite this page: “South Dakota Water Hardness by County.” Hard Water Map. Retrieved 2026-07-22, https://hardwatermap.com/water-hardness/south-dakota/